
 Click for Larger Image
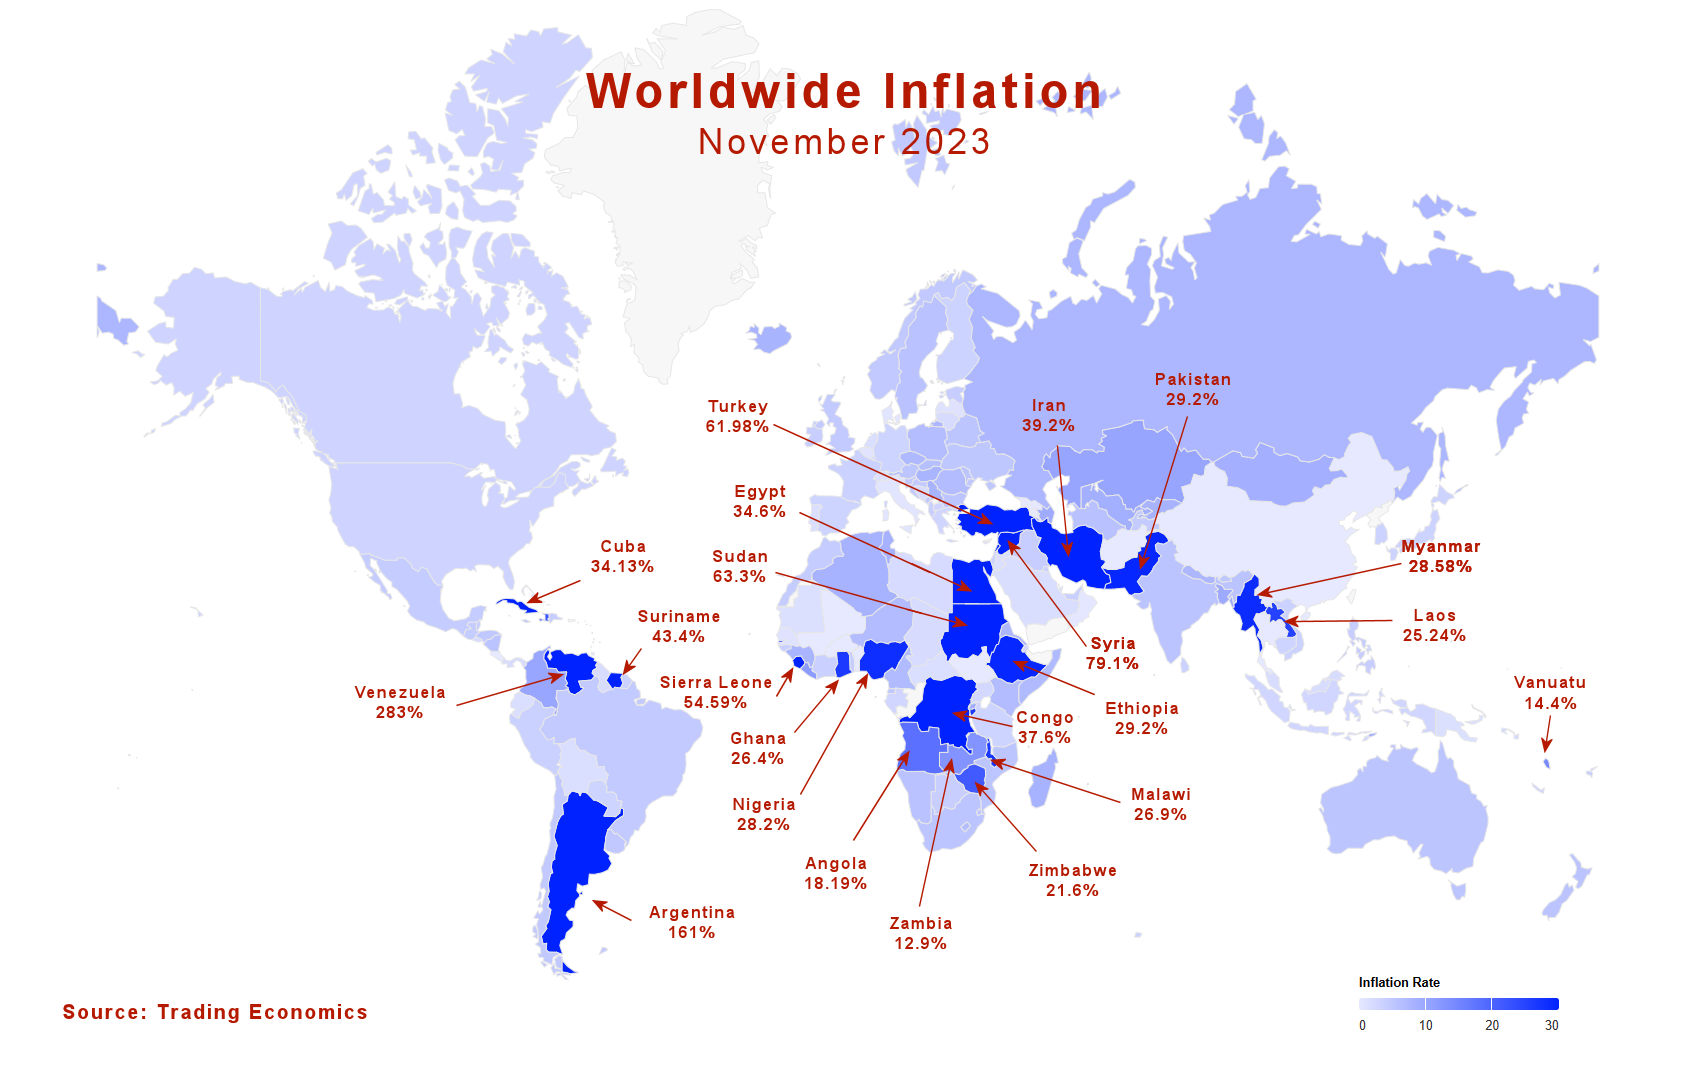
Even though Argentina is in the news due to its high inflation rate it isn’t the only country suffering from hyperinflation. It’s not even the highest inflation… with Venezuela and Lebanon even higher. In this article, we will look at global inflation rates by country and inflation around the world as of November 2023.
The World Inflation Rate
The average inflation rate around the world is 11.1%. The global inflation rate surged from 4.35% in 2021, and 3.18% in 2020.
Jump to:
- Top Hyperinflation Countries
- Inflation in Europe
- Countries with Deflation
- Low inflation Countries without Deflation
- Inflation in Asia
- Alphabetical Inflation Rate by Country
Countries with the Highest Inflation Rates
The countries with the highest inflation are not surprising each has suffered from high inflation before. The top ten have suffered from hyperinflation consistently even when the rest of the world had very low inflation rates. Last year, Sudan had the highest inflation rate in the world at 260%. This year it has fallen to number 5 with “only” 63.3% annual inflation. Venezuela on the other hand has moved from second place with 222% inflation up to first place with 283% inflation. We’ve been writing about Hyperinflation in Venezuela since they tried a Crypto scam to solve it in 2018. In an effort to solve their hyperinflation Argentina’s new president is considering dollarization, i.e., switching from their own currency to the U.S. Dollar.
Zimbabwe (the last country on this list) was in the triple-digit hyperinflation club back in 2008 and so Zimbabwe adopted the U.S. Dollar in 2009 knocking it well below the 2.2 million percent it was at. Although this temporarily helped their hyperinflation problem, unfortunately, their economy continued to stagnate primarily due to corruption, and despotism. So, in June 2019, their President decided to revert back to their own currency. Which of course did nothing to improve their economy except to reintroduce massive inflation. So, in 2023 they have instituted a gradual return to a dollarization. This year (2023), 77% of transactions were conducted in U.S. Dollars. Interestingly, Zimbabwe’s annual inflation as of November 2023 has dropped to “only” 21.6%.
Top Hyperinflation Countries
The following 22 countries all have inflation rates above 20%.
| 1 | Venezuela | 283.0% |
| 2 | Lebanon | 215.0% |
| 3 | Argentina | 161.0% |
| 4 | Syria | 79.1% |
| 5 | Sudan | 63.3% |
| 6 | Turkey | 62.0% |
| 7 | Sierra Leone | 54.6% |
| 8 | Suriname | 43.4% |
| 9 | Iran | 39.2% |
| 10 | Republic of the Congo | 37.6% |
| 11 | Egypt | 34.6% |
| 12 | Cuba | 34.1% |
| 13 | Ethiopia | 29.2% |
| 14 | Pakistan | 29.2% |
| 15 | Myanmar | 28.6% |
| 16 | Nigeria | 28.2% |
| 17 | Malawi | 26.9% |
| 18 | Burundi | 26.5% |
| 19 | Ghana | 26.4% |
| 20 | Laos | 25.2% |
| 21 | Haiti | 22.8% |
| 22 | Zimbabwe | 21.6% |
But we have to remember that these are the “official inflation rates” the actual real-life inflation experienced by consumers could easily be much higher or even double the official rate. Number 2 is Lebanon which is also suffering a repeat performance of hyperinflation. Syria remains as the 4th highest inflation in the world for another year and we wrote about its hyperinflation back in 2013.
Back in February 2022, we wrote about the Massive Gap Between Official Turkish Inflation and Reality. We have to remember that as Milton Friedman once said, “inflation is always and everywhere a monetary phenomenon”
Countries with Hyperinflation in 2022
Although it is difficult to say at what point high inflation becomes “hyperinflation” we have listed the top 10 inflation countries as “countries with hyperinflation in 2022”. These countries all have inflation rates above 30%.
| Country | Inflation Rate | Reference Date |
| Sudan | 260% | January 2022 |
| Venezuela | 222% | April 2022 |
| Lebanon | 206% | April 2022 |
| Syria | 139% | April 2022 |
| Zimbabwe | 96.4% | April 2022 |
| Turkey | 69.97% | April 2022 |
| Suriname | 61.5% | January 2022 |
| Argentina | 58% | April 2022 |
| Ethiopia | 36.6% | April 2022 |
| Iran | 35.6% | April 2022 |
Inflation in Europe 2022 vs 2023
In 2022 European inflation was on the upswing like most of the rest of the world. The following table compares April 2022 to November 2023. The European Area has done well to curb its inflation going from 7.4% to 2.4% although not all European countries have done so well. Ukraine at 5.1% has done better than Russia at 7.5%. Iceland’s inflation has actually increased over the last year from 7.2% to 8.0%.
| Country | Inflation Rate
April 2022 |
Inflation Rate
November 2023 |
| Turkey | 69.97% | 62.0% |
| Moldova | 27.1% | 5.5% |
| Estonia | 18.8% | 4.0% |
| Russia | 17.8% | 7.5% |
| Belarus | 16.8% | 5.4% |
| Lithuania | 16.8% | 2.0% |
| Ukraine | 16.4% | 5.1% |
| Bulgaria | 14.4% | 5.4% |
| Czech Republic | 14.2% | 7.3% |
| Romania | 13.76% | 6.7% |
| Latvia | 13% | 1.0% |
| Poland | 12.4% | 6.6% |
| Slovakia | 11.8% | 6.2% |
| Kosovo | 11.2% | 2.9% |
| Montenegro | 11.2% | 4.8% |
| Macedonia | 10.5% | NA |
| Bosnia and Herzegovina | 10.2% | 2.1% |
| Greece | 10.2% | 3.0% |
| Netherlands | 9.6% | 1.6% |
| Serbia | 9.6% | 8.0% |
| Hungary | 9.5% | 7.9% |
| Croatia | 9.4% | 4.7% |
| United Kingdom | 9% | 4.6% |
| Cyprus | 8.8% | 1.7% |
| Belgium | 8.31% | 0.8% |
| Spain | 8.3% | 3.2% |
| European Union | 8.1% | 3.6% |
| Euro Area | 7.4% | 2.4% |
| Germany | 7.4% | 3.2% |
| Austria | 7.2% | 5.4% |
| Iceland | 7.2% | 8.0% |
| Portugal | 7.2% | 1.5% |
| Ireland | 7% | NA |
| Luxembourg | 7% | 3.0% |
| Slovenia | 6.9% | 4.9% |
| Denmark | 6.7% | 0.6% |
| Sweden | 6.4% | 5.8% |
| Albania | 6.2% | 3.9% |
| Italy | 6% | 0.7% |
| Finland | 5.7% | 3.3% |
| Malta | 5.4% | 4.2% |
| Norway | 5.4% | 4.8% |
| France | 4.8% | 3.5% |
| Faroe Islands | 4.4% | 3.7% |
| Switzerland | 2.5% | 1.4% |
| Liechtenstein | 1.5% | 1.4% |
EU Inflation Rate aka. European Inflation Rate
The European Union (EU) inflation rate is 3.6%. If, as we’ve already said, inflation is a monetary phenomenon, how can various EU countries have different inflation rates? According to the European Central Bank (ECB) “The euro area economies have experienced a considerable degree of inflation rate convergence during the past decade.” So having the same Central Bank has tended to stabilize the individual European country’s inflation rates. But each country still has control over its own spending, borrowing, and taxation policies but they can’t set their own interest rates, which creates stresses within the EU financial system. It is also important to note that NOT all EU Countries use the EURO so they may not even have the same currency.
Countries with Deflation
Ten countries have negative inflation, i.e., falling prices aka. “deflation”. Although deflation is demonized by big debtors like the U.S. government it is not always bad. It can be a sign of increasing productivity although it can also signify a contracting economy.
| Afghanistan | -8.0% |
| South Sudan | -3.3% |
| Seychelles | -2.7% |
| Mali | -1.8% |
| Costa Rica | -1.7% |
| Burkina Faso | -1.6% |
| Armenia | -0.5% |
| China | –0.5% |
| Thailand | –0.4% |
| Benin | -0.2% |
Low inflation Countries without Deflation
| Bahrain | 0.0% |
| Brunei | 0.1% |
| Georgia | 0.1% |
| Oman | 0.3% |
| Denmark | 0.6% |
| Italy | 0.7% |
| New Caledonia | 0.7% |
| Belgium | 0.8% |
| Senegal | 0.9% |
| Latvia | 1.0% |
| Macau | 1.1% |
| Qatar | 1.3% |
| Cape Verde | 1.3% |
| Jordan | 1.3% |
| Mauritania | 1.3% |
| Trinidad and Tobago | 1.3% |
| Liechtenstein | 1.4% |
| Switzerland | 1.4% |
| Papua New Guinea | 1.4% |
| Ecuador | 1.5% |
| Portugal | 1.5% |
| Bolivia | 1.6% |
| Netherlands | 1.6% |
| Central African Republic | 1.6% |
| Aruba | 1.7% |
| Saudi Arabia | 1.7% |
| Cyprus | 1.7% |
| Guyana | 1.8% |
| Malaysia | 1.8% |
| Chad | 1.9% |
| Lithuania | 2.0% |
Asian Inflation
Chinese inflation was one of the lowest inflation rates in the world at 2.1% as of April 2022. However, like in many other countries, the official China Inflation Rate may not represent real-life inflation i.e. what actual Chinese consumers pay. In 2023 they have fallen to -0.5% deflation so prices are actually falling.
The Philippine inflation rate is relatively moderate at 4.1% down from 4.9%, South Korea is 3.3% down from 4.8%, and Thailand has followed China into deflation at -0.4% down from 4.65%. Japan has a national inflation rate of 3.3% up from 2.5%, Vietnam is at 3.5% up from 2.64%, Malaysia has 1.8% down from 2.2%, and Hong Kong has 2.7% up from 1.7%.
Alphabetical Inflation Rate by Country
| Afghanistan | -8.0% |
| Albania | 3.9% |
| Algeria | 8.2% |
| Angola | 18.2% |
| Argentina | 161.0% |
| Armenia | -0.5% |
| Aruba | 1.7% |
| Australia | 5.4% |
| Austria | 5.4% |
| Azerbaijan | 9.4% |
| Bahrain | 0.0% |
| Bangladesh | 9.5% |
| Barbados | 4.3% |
| Belarus | 5.4% |
| Belgium | 0.8% |
| Belize | 4.3% |
| Benin | -0.2% |
| Bermuda | 2.7% |
| Bhutan | 5.1% |
| Bolivia | 1.6% |
| Bosnia and Herzegovina | 2.1% |
| Botswana | 3.9% |
| Brazil | 4.7% |
| Brunei | 0.1% |
| Bulgaria | 5.4% |
| Burkina Faso | -1.6% |
| Burundi | 26.5% |
| Cambodia | 3.2% |
| Cameroon | 6.9% |
| Canada | 3.1% |
| Cape Verde | 1.3% |
| Cayman Islands | 4.1% |
| Central African Republic | 1.6% |
| Chad | 1.9% |
| Chile | 4.8% |
| China | -0.5% |
| Colombia | 10.2% |
| Comoros | 8.0% |
| Costa Rica | -1.7% |
| Croatia | 4.7% |
| Cuba | 34.1% |
| Cyprus | 1.7% |
| Czech Republic | 7.3% |
| Denmark | 0.6% |
| Djibouti | 2.6% |
| Dominican Republic | 4.0% |
| East Timor | 8.7% |
| Ecuador | 1.5% |
| Egypt | 34.6% |
| El Salvador | 2.1% |
| Equatorial Guinea | 5.0% |
| Eritrea | 7.5% |
| Estonia | 4.0% |
| Eswatini | 5.0% |
| Ethiopia | 29.2% |
| Faroe Islands | 3.7% |
| Fiji | 4.0% |
| Finland | 3.3% |
| France | 3.5% |
| Gabon | 2.9% |
| Georgia | 0.1% |
| Germany | 3.2% |
| Ghana | 26.4% |
| Greece | 3.0% |
| Guatemala | 4.3% |
| Guinea | 7.9% |
| Guinea-Bissau | 3.8% |
| Guyana | 1.8% |
| Haiti | 22.8% |
| Honduras | 5.0% |
| Hong Kong | 2.7% |
| Hungary | 7.9% |
| Iceland | 8.0% |
| India | 5.6% |
| Indonesia | 2.9% |
| Iran | 39.2% |
| Iraq | 4.1% |
| Israel | 3.3% |
| Italy | 0.7% |
| Ivory Coast | 3.7% |
| Jamaica | 5.1% |
| Japan | 3.3% |
| Jordan | 1.3% |
| Kazakhstan | 10.3% |
| Kenya | 6.8% |
| Kosovo | 2.9% |
| Kuwait | 3.8% |
| Kyrgyzstan | 8.1% |
| Laos | 25.2% |
| Latvia | 1.0% |
| Lebanon | 215.0% |
| Lesotho | 6.5% |
| Liberia | 11.7% |
| Libya | 2.1% |
| Liechtenstein | 1.4% |
| Lithuania | 2.0% |
| Luxembourg | 3.0% |
| Macau | 1.1% |
| Madagascar | 8.2% |
| Malawi | 26.9% |
| Malaysia | 1.8% |
| Maldives | 2.6% |
| Mali | -1.8% |
| Malta | 4.2% |
| Mauritania | 1.3% |
| Mauritius | 4.0% |
| Mexico | 4.3% |
| Moldova | 5.5% |
| Mongolia | 8.6% |
| Montenegro | 4.8% |
| Morocco | 4.3% |
| Mozambique | 5.4% |
| Myanmar | 28.6% |
| Namibia | 5.7% |
| Nepal | 7.5% |
| Netherlands | 1.6% |
| New Caledonia | 0.7% |
| New Zealand | 5.6% |
| Nicaragua | 5.7% |
| Niger | 6.8% |
| Nigeria | 28.2% |
| North Macedonia | 3.1% |
| Norway | 4.8% |
| Oman | 0.3% |
| Pakistan | 29.2% |
| Palestinian National Authority | 11.4% |
| Panama | 2.1% |
| Papua New Guinea | 1.4% |
| Paraguay | 3.2% |
| Peru | 3.6% |
| Philippines | 4.1% |
| Poland | 6.6% |
| Portugal | 1.5% |
| Puerto Rico | 2.7% |
| Qatar | 1.3% |
| Republic of Ireland | 3.9% |
| Republic of Congo | 37.6% |
| Romania | 6.7% |
| Russia | 7.5% |
| Rwanda | 9.4% |
| São Tomé and Príncipe | 13.0% |
| Saudi Arabia | 1.7% |
| Senegal | 0.9% |
| Serbia | 8.0% |
| Seychelles | -2.7% |
| Sierra Leone | 54.6% |
| Singapore | 4.7% |
| Slovakia | 6.2% |
| Slovenia | 4.9% |
| Solomon Islands | 2.3% |
| Somalia | 7.1% |
| South Africa | 5.5% |
| South Korea | 3.3% |
| South Sudan | -3.3% |
| Spain | 3.2% |
| Sri Lanka | 3.4% |
| Sudan | 63.3% |
| Suriname | 43.4% |
| Sweden | 5.8% |
| Switzerland | 1.4% |
| Syria | 79.1% |
| Taiwan | 2.9% |
| Tajikistan | 4.4% |
| Tanzania | 3.2% |
| Thailand | -0.4% |
| The Bahamas | 2.2% |
| The Gambia | 18.1% |
| Togo | 3.9% |
| Trinidad and Tobago | 1.3% |
| Tunisia | 8.3% |
| Turkey | 62.0% |
| Turkmenistan | 5.9% |
| Uganda | 2.6% |
| Ukraine | 5.1% |
| United Arab Emirates | 3.8% |
| United Kingdom | 4.6% |
| United States | 3.1% |
| Uruguay | 5.0% |
| Uzbekistan | 8.8% |
| Vanuatu | 14.4% |
| Venezuela | 283.0% |
| Vietnam | 3.5% |
| Zambia | 12.9% |
| Zimbabwe | 21.6% |
Articles Linked Above:
- What is Hyperinflation?
- Can Crypto Solve Venezuela’s Hyperinflation?
- Hyperinflation strikes Lebanon… Again
- Syria’s Hyperinflation
- Zimbabwe Inflation 2.2 million Percent
- Zimbabwe Switches to the U.S. Dollar
- Hyperinflation in Turkey and Argentina Today
- Sanctions against Russia
- Deflation and Depression through the Years
- Argentina Mulls Dollarization
- Worldwide Inflation by Country 2022
World Inflation Data and map Courtesy of Trading Economics where you can view the full list of Nations and their inflation rates.

Leave a Reply