 In today’s post, Daniel Lacalle looks at the problems plaguing the eurozone. He says their major problems aren’t China, rate hikes, or the Ukraine war. Instead, he demonstrates that the curse of the eurozone is central planning. Subsidizing obsolete sectors and zombie firms, bloated government spending, and high taxes. ~Tim McMahon, editor
The Eurozone Disaster: Between Stagnation and Stagflation
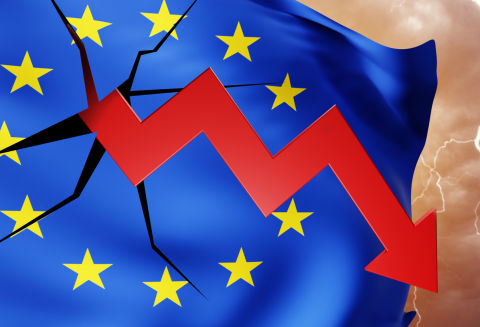
The eurozone economy is more than weak. It is in deep contraction, and the data is staggering.
The eurozone manufacturing purchasing managers’ index (PMI), compiled by S&P Global, fell to a three-month low of 43.1 in October, the sixteenth consecutive month of contraction. However, European analysts tend to ignore the manufacturing decline using the excuse that the services sector is larger and stronger than expected, but it is not. The eurozone Composite PMI is also in deep contraction at 46.5, a thirty-five-month low, and the services sector plummeted to recession territory at 47.8, a thirty-two-month low.
Some analysts blame the energy crisis and the European Central Bank (ECB) rate hikes, but this makes no sense. The eurozone should be outperforming the United States and China because the energy crisis reverted almost immediately. Between May 2022 and June 2023, all commodities, including natural gas, oil, and coal, as well as wheat, slumped and fell to pre-Ukraine war levels. A mild winter and the impact of monetary contraction created a strong stimulus that should have helped the eurozone, and there were no supply disruptions. In fact, the contribution of the external sector to GDP helped the area avoid a recession, as exports remained healthy while imports declined.
Blaming the eurozone recession on the ECB’s monetary policy is also unfair. The eurozone inflation is unacceptable, and, as the studies of Borio and Congdon and Castañeda prove, inflation was caused by excessive money growth. Furthermore, the ECB’s monetary policy remains hugely accommodating. In fact, the misguided antifragmentation program continues to support the debt of fiscally irresponsible countries. The ECB’s balance sheet is more than 50 percent of the gross domestic product (GDP) of the euro area, compared to the Federal Reserve’s 30 percent.
Fiscal and monetary policy remains expansionary.
Governments can spend at will, as the fiscal rules and limits have been suspended. Therefore, fiscal and monetary conditions are a Keynesian dream. There is more, because the much-trumpeted EU Next Generation Fund, a €750 billion stimulus package aimed at strengthening growth and productivity, is in full swing.
Now put all this together. Massive stimulus packages, deficit spending, accommodative monetary policy, and the external support of cheap natural gas and coal . . . And there is no growth.
Blaming it on China’s slowdown is lazy. If eurozone growth was driven by exports to China, Germany would not have been on the verge of recession, with France and Italy delivering zero growth in 2019, for example. Furthermore, the poor growth of the eurozone between 2011 and 2019 coincided with a period of extraordinary expansion in China.
The problem of the eurozone is not China, rate hikes, or the Ukraine war. The curse of the eurozone is central planning. Subsidizing obsolete sectors and zombie firms, bloating government spending, and massively increasing taxes on the most productive sectors are driving away technology, industry, and high-productivity sectors. Government current spending is now the main component of GDP in countries like France or Belgium and is rising all over the eurozone. Implementation of politically imposed economic decisions has crippled euro area opportunities, and energy policy is a key area of stagnation in the economy. A misguided energy policy makes industry less competitive and the economy more vulnerable as power and natural gas prices for households and industries are significantly more expensive than in China or the US due to the accumulation of taxes and regulatory burdens.
The ECB does not have to decide between inflation and growth. This is a false dilemma. There is plenty of growth without inflation in high-productivity economies. The problem is that European governments believe all their fiscal imbalances will be disguised by monetary policy and demand negative real rates and constant monetization of debt. Thus, the ECB will have to choose between stagnation and stagflation because governments are forcing it.
You might also like:
- The Eurozone Falls into Recession as Stimulus Fails
- The European Energy Crisis May Be Back Soon
- Will a New BRICS Currency Dethrone the U.S. Dollar?
- How Germany is Fudging Their Inflation Numbers
This article originally appeared here and has been reprinted under the Creative Commons license. 
About the Author:
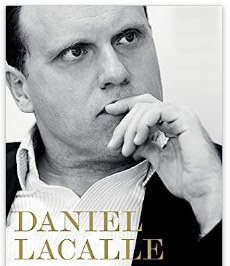 Daniel Lacalle, PhD, is a professor of global economy at IE Business School in Madrid, an economist, and a fund manager. He was Ranked as one of the top twenty most influential economists in the world in 2016 and 2017 by Richtopia, and the author of the bestselling books Freedom or Equality (2020), Escape from the Central Bank Trap (2017), The Energy World Is Flat (2015), and Life in the Financial Markets (2014).

Leave a Reply