
Recently I came across a Newspaper ad from 1964 which coincidentally is almost exactly 60 years ago. So, I thought I would look up how much inflation we’ve had in the last 60 years. According to the U.S. Bureau of Labor Statistics (BLS), total inflation from November 1963 to November 2023 is 896.92%. So, $100 after adjusting for inflation is $996.92. Therefore, we would expect everything to cost about 10 times as much as it did in 1963.
Note: We’ve used November 1963, and November 2023 because that is the most recent data from the U.S. Bureau of Labor Statistics.
The advertisement that got me started on this trip down memory lane was for a 1964 RCA Color Television.
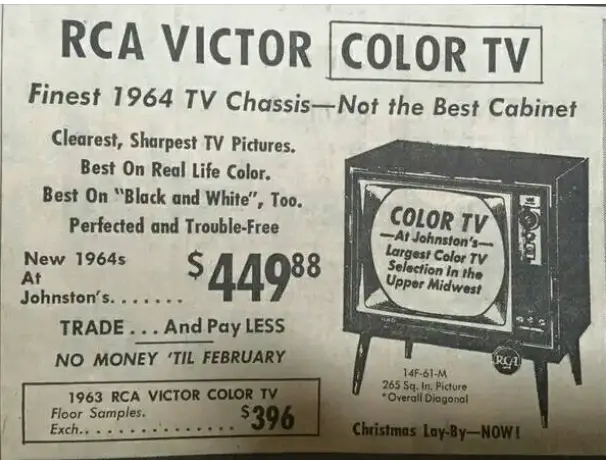
In those days much of the price of a TV was based on how fancy the cabinet was. After all, you were buying a piece of furniture. This ad specifically states that you’re mostly getting a TV but not much of a cabinet (which makes it a good comparison for today’s TVs). Also note that in 1964 you could trade in your old TV and get a discount.
You could also buy used TVs and there was a TV repair shop on almost every corner, where they would replace the old tubes on your TV. Today, if your TV breaks you just throw it away and get another one (and we will see why that is possible in a moment).
Fancy cabinets from Sylvania looked like this and cost much more than $449.88.

Or you could get this one from Magnavox, that brags about not having “tubes”, i.e., it had “solid-state” electronics. And it included a record player as well.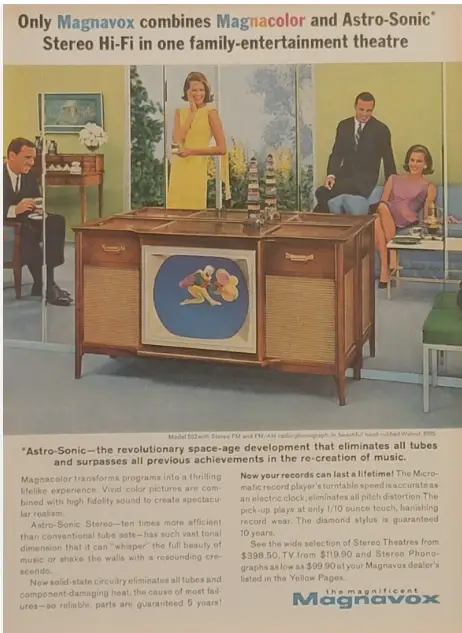
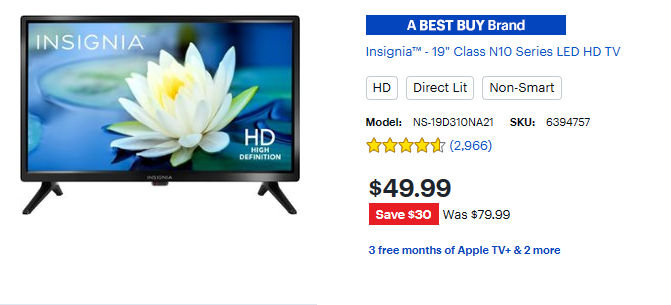
But we are comparing the RCA $449.88 model to what you can get today. Instead of costing ten times more, for one-tenth of the price you can get a TV of comparable size to the 1964 TV. It’s hard to tell from the 1964 ad exactly what the screen size is but it is probably very close to this 49-dollar, 19″ TV.
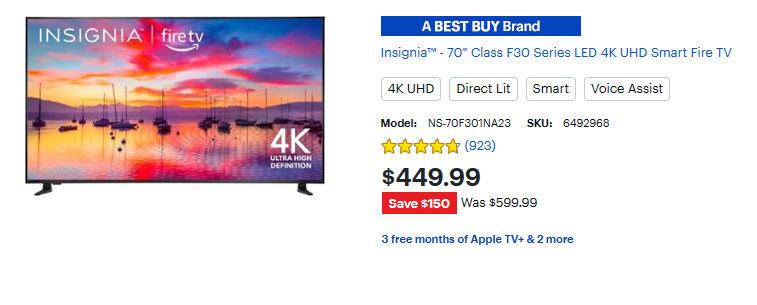
Rather than a comparable TV costing $4490 (i.e. ten times the 1964 price). For almost exactly, the same price you can get a 70″ LED Smart TV from Best Buy. This TV would be considered sci-fi stuff in 1964. And in 1964 inflation-adjusted dollars, it would cost the equivalent of $44.99.
According to the U.S. Census Bureau, the median income of all families in 1964 was about $6,600. That means that the economy model $449 TV would cost the average family 6.8% of their annual income. Can you imagine paying almost 7% of your income for a TV?
Finmasters, estimates the median salary in 2023 to be $56,473. So, 6.8% of that would be about $3849. And yes, you can get a TV for that price today, but it is much bigger, clearer, and has many more features than the 1964 model.
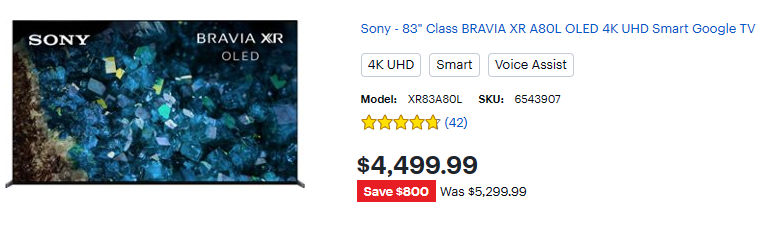
If you want to spend the inflation-adjusted price (10x) of the 1964 price, you can get this 83″ Sony 4k Smart TV.
Hedonics
Which of these modern TVs should the BLS compare their prices to the TV from 1964? Well, to adjust for the differences in quality the BLS uses something called “hedonics”.
According to the BLS “Hedonic quality adjustment is one of the techniques the CPI uses to account for changing product quality within some CPI item samples. Hedonic quality adjustment refers to a method of adjusting prices whenever the characteristics of the products included in the CPI change due to innovation or the introduction of completely new products.”
Median Income Comparison
If we look at the median income and compare that to 1964 we can see… Once again… Total inflation from November 1963 to November 2023 is 896.92% and $6600 after adjusting for inflation is $65,796.64. So, just looking at it that way, it appears that the median American hasn’t kept up. However, the 2023 average salary of a full-time worker in the U.S. amounts to $76,554 per year. An average can be heavily skewed by a few very high or very low values, so the median is usually a better overall guide. But based on this average, we can see that some Americans are doing better than inflation.
But when it comes to buying things like TVs, Computers, and iPhones most people today are much better off. You aren’t forced to spend 6.8% of your income on an economy-model TV. If you are very frugal, you could spend $49.99 (less than 1/10th of 1% of an annual income of $56,473). Even if you only spend 1% of your annual $56,473 income, i.e., $564. you can get a huge TV. This is the reason people can afford to throw away a TV rather than fix it… because it costs a much smaller fraction of their total income. They can buy 6.8 TVs for the same percentage of their income.
So, even if theoretical incomes haven’t kept up with inflation the standard of living has vastly improved due to technological improvements. In 1964, families had one phone attached to the wall… often in the kitchen. Now, almost everyone has their own personal smartphone, that they carry with them everywhere. In 1964, the average single-family home was 1,470 sq. ft., most didn’t have A/C, only 10% of houses had 2.5 baths (or more), only 45.9% had dishwashers, many only had a tub (no shower), only 73.5% had a clothes washer, and 70.2% had a clothes dryer.
In 2009, (the most recent data I could find), 99.8% of houses had a tub and shower, 47.9% had 2.5 baths (or more), 88.7% had A/C, 93% had a dishwasher, 89.1% had a washing machine, 88.4% had a clothes dryer, 93.8% had smoke detectors, and the average house is over 2000 sq. ft. We can only assume these percentages have risen even more in the last decade.
In addition to personal cell phones, smart watches and computers are everywhere.
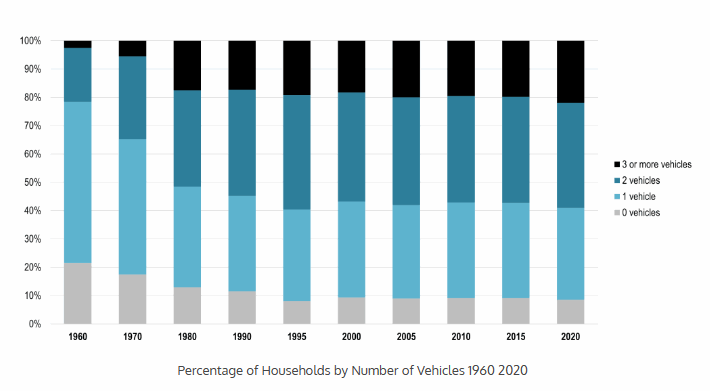
Number of Vehicles per Household
In the 1960s, 20% of the households had no vehicle, 60% had only one vehicle, about 15% had two vehicles, and only a couple of percent had 3 or more vehicles. In 2020, 8.45%% had no vehicle (mostly out of choice due to living in the city), i.e., 91.55% of households had at least one vehicle, almost 40% of households had two vehicles and more than 20% of households had 3 or more vehicles.
 Obviously, based on conveniences, cars, and home size, the standard of living has vastly improved since the 1960s, and the cost of “tech” has drastically decreased not just in inflation-adjusted terms but even in nominal dollar terms.
You might also like:
- Food Price Inflation Since 1913
- Cost of Living: How Much of Your Budget Goes to Food?
- Cost of Living- Real Basket of Goods
- Its Weight in Gold: The Real Prices of Things
- Cost of Living
- Cost of Living- Fish and Chips
- Housing Prices and Inflation

Leave a Reply