
 People are often confused about the difference between DEFLATION and DISINFLATION. Deflation is when prices are actually falling compared to last year, i.e., you will actually pay less for enough items to reduce your cost of living. It doesn’t necessarily mean that everything costs less but enough items cost less to make the inflation rate negative.
Disinflation on the other hand, simply means that the rate of inflation is slowing. This could be for as little as one month, i.e., annual inflation was 4% in May 2023 and then it was 3% in June 2023. That is a big disinflation. But it was 3.2% in July 2023. So there was no monthly disinflation but there was still disinflation over two months since July was still lower than May.
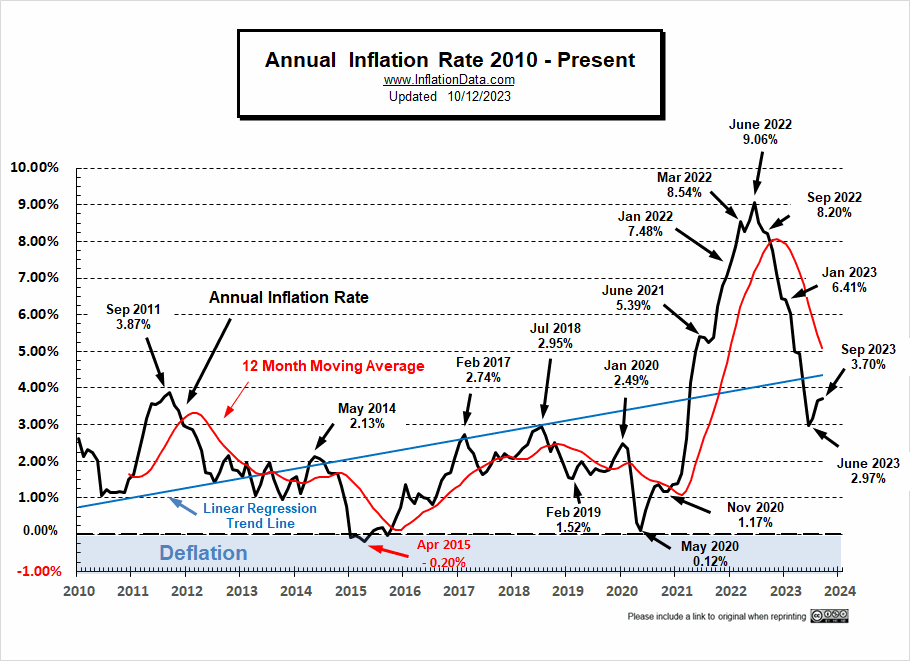
Currently, July through September have each had higher annual inflation rates than the previous month, so there is no monthly disinflation but on an annual basis, inflation at 3.7% (September 2023) is still lower than last year’s 8.2% (September 2022).
In today’s article, Brendan Brown looks at the causes of the disinflation from the peak at 9.06% in June 2022 to the 2.97% low in June of 2023, and then the subsequent rise through September 2023. He also explains why he calls it a “phony disinflation”.~Tim McMahon, editor
The Great Phony Disinflation Enters Its Finale
By Brendan Brown
“La commedia è finita!” (an Italian phrase meaning the farce is over), summarizes where the United States and Europe now stand in the “Great Phony Postpandemic Disinflation”. Why phony? Reported consumer price index (CPI) inflation has been falling in the US and Europe, but this has little to do with the advertised monetary tightening by the Federal Reserve, European Central Bank (ECB), and Bank of England. (See: How Germany is fudging their inflation numbers).
Rather, the decline in reported CPI inflation is consistent with a natural downward rhythm of prices, reflecting fading pandemic restraints on supply. In a good money system, the essence of which is the absence of monetary inflation, average consumer prices (as represented by the CPI) would have long ago returned to their pre-pandemic levels.
Instead, in the financial marketplace and its surroundings, where the propaganda of the present monetary regime holds considerable sway, celebrations of the Fed’s “victory” are underway. US CPI inflation has fallen to three percent, on the road to two percent by year-end. Never mind that the dollar’s purchasing power will by then have fallen more than 15 percent since the eve of the pandemic.
Never mind that the dollar’s purchasing power will by then have fallen more than 15 percent since the eve of the pandemic.
Historically, when central banks defy—always by monetary inflation—a natural downward rhythm of prices, there follows a combination of asset inflation and a concealed inflation of goods and services. The symptoms of monetary inflation in goods and services markets are partly or wholly muted by a falling of prices stemming from events such as a relaxation of supply restraints, a surge in productivity, and the end of famine or war.
The apparent reprieve from consumer price inflation dampens popular resentment toward continuing monetary inflation. Hence big government and its cronies from Big Finance and Big Tech, or further afield, have extra scope to reap the benefits of monetary inflation.
The post-pandemic period (say mid-2022 to the present) has been consistent with the historical pattern. Well-recognized symptoms of asset inflation continue, such as prosperity in the private equity business or, more generally, the financial engineering industry. At the same time, temperature readings of speculation in important parts of the global equity markets are feverish, with prices rebounding in some home markets.
The brief asset market sell—offs in the summer and autumn of 2022 were a false alarm of disinflation. It seemed to many at the time that the Fed was serious about ending monetary inflation—even though skeptics pointed to how it had spent the winter and spring talking about a hawkish turn without taking any substantive action.
The Fed has raised interest rates by four percentage points since the summer of 2022, but students of monetary economics 101 (as long as they have not been taught by a neo-Keynesian zealot) know that interest rates are highly flawed indicators of whether money is tight or easy. Interest rates can climb without any monetary tightening when, for example, confidence that money will retain purchasing power falls or demand for credit grows. Monetary inflation monitors should instead focus on a monetary aggregate, ideally base money. The problem, however, is that base money no longer has any signaling function or capacity to have a reliable monetary anchor attached to it.
In particular, the payment of interest at the policy rate on reserve deposits at the Fed since the autumn of 2008 has neutered base money. Base money holdings, either as direct holdings or as deposits backed by large reserves, have increased greatly relative to other assets, such that at the margin they no longer yield any special monetary services, the feature which in a good money system sets base money apart from short-term debt securities. Hence change in the supply of the monetary base relative to demand is no longer a powerful monetary force.
It could well be the case now (midsummer 2023) that monetary inflation is still robust. When the natural downward rhythm of prices begins to ease with the maturing of the postpandemic upward adjustment of supply, symptoms of monetary inflation in the goods and services markets could become more troubling. And in the looming election year, who would trust the Fed to respond promptly with any significant action?
That is a mainstream scenario of concern. But it is not the only scenario! In a disanchored monetary system, money works in strange, sometimes surprising, and sometimes hard-to-recognize ways. The big rise in nominal interest rates, which has affected short maturities the most, has caused stress in specific areas. This stress could turn asset inflation into asset deflation.
Such deflation could occur without any obvious monetary disinflation at first because of an endogenous “revulsion.” This could include tiring speculative narratives, credit defaults in highly leveraged areas, disappointing profits and earnings as malinvestments accumulate, cumulative damage wrought by advancing monopoly capitalism, and changes in human spending propensities caused by present liabilities and perceived future opportunities.
The cash flow effects of a big rise in nominal rates, even if the rise is much smaller in real terms, can trigger endogenous revulsion. In highly leveraged areas, borrowers who have taken advantage of inflation to reduce their debts in real terms may be more vulnerable to rate increases. The size of their gains under inflation, as well as their degree of vulnerability to a rise in interest rates, depends in part on their asset composition. The fivefold or more rise in interest expense (once the new rates apply—and there are considerable lags) could cripple a business’s capacity to service its debts. In principle, the business could extend its maturities or replace debt with equity, but those options might not be available in areas where business conditions have weakened.
The big increase in nominal rates—even if it does not come with effective monetary tightening—might unleash credit problems which could set off an endogenous revulsion causing asset inflation to transition to asset deflation. Such catalysts could include problems in banking or near-banking institutions which during asset inflation leveraged themselves on what have since emerged as bad bets, such as big carry trade bets on long-maturity versus short-maturity debts, high-interest versus short-interest currencies, and risky versus safe credit.
Carry trade business is alive and well—especially in the still zero- or negative-interest yen and the near-zero-interest yuan. Huge demand for high-yield and other speculative paper from investors using yuan and yen funds explains in part why asset inflation has so far sustained itself so well in the US and elsewhere, but endogenous revulsion could still set in. Japanese institutional investors scurrying to eke out higher returns by borrowing US dollars to put into high-yield US credit paper might hit a wall in terms of the risk tolerance of their stakeholders (whether equity or pension managers).
Shrinking world trade, climbing geopolitical risk as the US-led proxy war against Russia escalates in Ukraine, and the specter of national bankruptcy add to the risk of endogenous revulsion. In any case, yuan- and yen-based demand cannot sustain global asset inflation all on its own. That “privilege” rests firmly with the Fed.
More from Brendan Brown:
Article: Default by Inflation
Books:
- Europe’s Century of Crises under Dollar Hegemony,
- The Case Against 2 Per Cent Inflation
- How Asset Price Inflation Destroys the Wealth of Nations
- The Global Curse of the Federal Reserve.
This article originally appeared here and has been reprinted under the Creative Commons License.![]()
You might also like:

Leave a Reply