• Home
  • Related Sites
    • Financial Trend Forecaster
      • Moore Inflation Predictor
      • NYSE Rate of Change (ROC)
      • NASDAQ Rate of Change (ROC)
      • Crypto ROC- BTC & ETH
    • Unemployment Data
      • Historical Employment Data
      • Unemployment Rate Chart
      • Labor Force Participation Rate
    • Optio Money
    • Elliott Wave University
    • More Resources
  • Definitions
    • What is Inflation?
    • What is Core Inflation?
    • Inflation vs CPI
    • What is Deflation?
    • What is Disinflation?
    • What is Agflation?
    • What is Stagflation?
    • What is Hyperinflation?
    • What is Quantitative Easing?
    • What is Quantitative Tightening?
    • What is Velocity of Money?
    • What is Fiat Currency?
    • How Do I Calculate Inflation?
    • What are “Sticky Prices” and Why Do They Matter?
  • Featured Content
  • About Us
  • Feedback
    • Sitemap
  • Subscribe Now

InflationData.com

Your Place in Cyber Space for Inflation Data

CPIWidget-Jan26
  • Numerical Inflation Data
    • Current Inflation Rate
    • Monthly Inflation Rate (Moved)
    • Historical U.S. Inflation Rates
    • Historical CPI
  • Inflation Charts
    • Ann. Inf. Rate Chart
    • Long Term Inflation >
      • Ave. Inf. by Decade
      • Total Inf. by Decade
      • Inflation 1913-1919
      • Inflation 1920-1929
      • Inflation 1930-1939
      • Inflation 1940-1949
      • Inflation 1950-1959
      • Inflation 1960-1969
      • Inflation 1970-1979
    • Cumulative Inflation
    • FED Monetary Policy and Inflation
    • Inflation and Recession
    • Confederate Inflation (1861 – 1865)
    • Misery Index
    • The 3 Stages of Inflation
    • 15-Yr Inflation Trends Chart
  • Inflation Calculators
    • Cumulative Inf. Calc.
    • How Much Would it Cost
    • Salary Inf. Calc.
    • Cost of Living Calc.
    • U.K. Inf. Calc.
    • Cost of Gas Calc.
    • Net Worth Calc.
    • Lifetime Earnings Calc.
    • Savings Goal Calc.
    • Financial Calculators
  • Inf. Adjusted Prices
    • Energy >
      • Inflation Adj. Gas Prices
      • Historical Oil Prices Chart
      • Crude Oil Price (Table)
      • Natural Gas Prices
      • Electricity Prices
      • Oil vs Gold
    • Gold >
      • Inflation Adjusted Annual Average Gold Prices
      • Gold is a “Crisis Hedge” not an  “Inflation Hedge”
      • Comparing Oil vs. Gold
    • Corn Prices
    • Education Inflation
    • Housing Prices
    • Mortgage Rates
    • NYSE Index
    • Inf. Indexed Bonds
    • Movie Revenues
    • Inflation-Adjusted Wages
  • Cost of Living
    • Calculate Cost of Living
    • Cost-of-living Adj. (COLA)
    • Consumer Price Index CPI
      • Historical CPI
      • Current CPI
      • CPI Release Dates
    • Gas Prices >
      • Cost of Gas
      • Cost of Gas Per Month
      • Gas vs. Oil Price Chart
    • Food Prices 1913 vs 2013
    • Health Insurance
  • Blog
    • Key Inflation Articles
    • International Inflation
    • Historical Inflation Rates for Japan (1971 to 2014)
You are here: Home » Blog » Commodities » Have Commodity Prices Peaked? Does That mean Recession?

Have Commodity Prices Peaked? Does That mean Recession?

Published on July 29, 2022 by Tim McMahon Leave a Comment

A recent article from Elliottwave International suggests the possibility that Aluminum, Copper and Zinc may have peaked on March 7-8th. They included the following chart…

Aluminum-Copper-Zinc

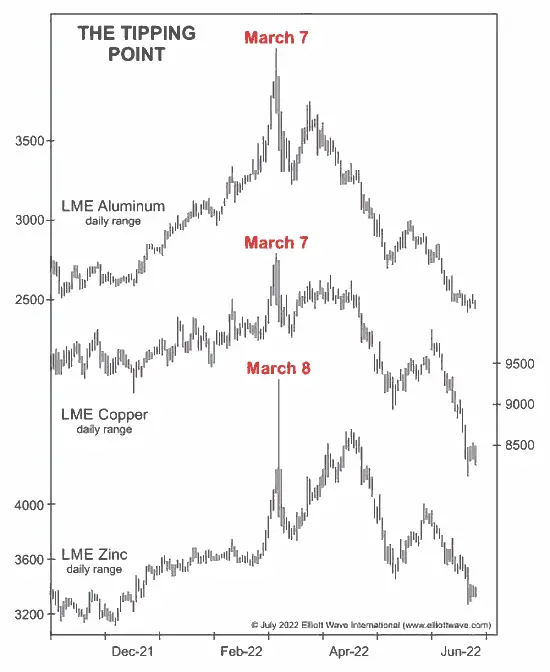
And the following commentary:

The Goldman Sachs Spot Commodity Index hit a high on March 8, and so did the Bloomberg Commodity Index. Crude oil futures made an intraday high on March 7 and a closing high on March 8. Platinum reached a closing high on March 7.

Commodity prices are leading indicators of overall inflation since they are components of every consumer good. Another major component affecting all other prices is gasoline and oil. According to AAA, regarding the price of gasoline… National Average Falls, But Rebounding Gas Demand and Crude Prices May Change Its Course.

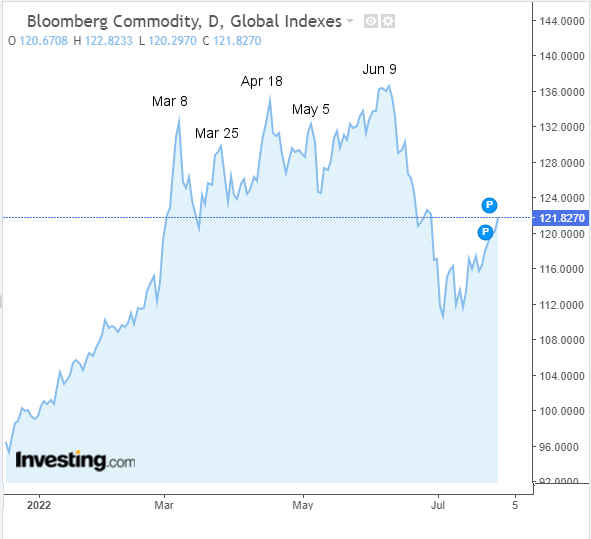
Looking at the Bloomberg Commodity index chart, we do see a peak on March 8th followed by a lower peak on March 25th. But then we see a higher peak on April 18th followed by a lower peak on May 5th. Then on June 9th we saw a final peak followed by a massive decline. Currently, prices seem to be rebounding but now they are facing the resistance of all the previous lows since March 8th. It is quite possible that we will see a test of the low right after the May 5th peak and then a decline from there. If so it could mean that inflation is moderating.

Bloomberg Commodity Index Chart

Falling Prices = Falling Demand = Recession?

Falling prices could be the result of increased supply or it could indicate that demand for commodities is falling due to a weakening economy. That could mean we are on the verge of a recession. One definition of a recession is two consecutive quarters of declining GDP, and we now have that, but the Biden administration is objecting to that definition because unemployment is so low. In the past, here at InflationData, we have relied on the National Bureau of Economic Research (NBER) to determine the official start a finish of a recession, and they do include unemployment in their calculations. They are also always “behind the curve” in announcing their determination simply because they can’t know when a peak has occurred until after it has happened. So the two-quarters of decline is more of a leading indicator, while the NBER’s official pronouncement of a “top” or bottom always occurs months after the fact.

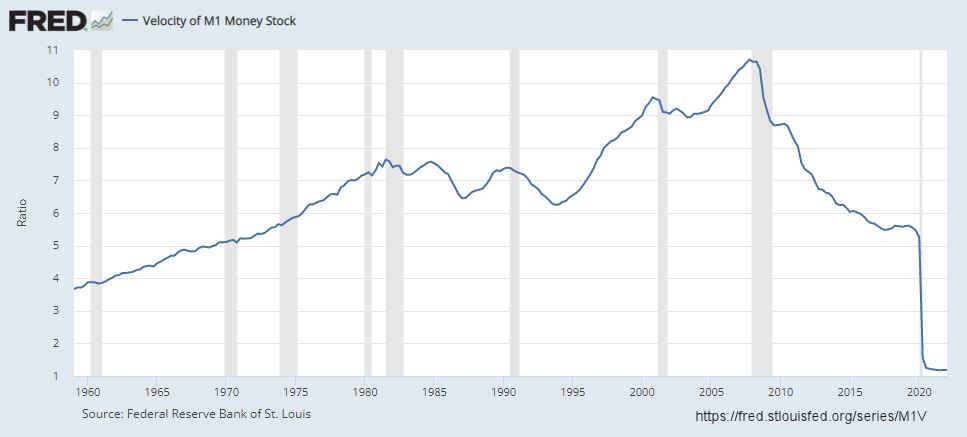
As we recently said in our updated article on the money multiplier, the current inflation situation is certainly different. As we can see in the following chart from the velocity of money (VOM) article, VOM is at historically low levels. This typically doesn’t occur during inflationary periods. Typically as inflation heats up, people rush to spend it before it becomes worthless or at least worth less. But during recessions, people hold onto their money for longer. One reason VOM hasn’t accelerated with inflation is that Millennials have Zero experience with inflation and don’t understand how devastating to purchasing power it can be.

Velocity of MoneyThis lack of experience, combined with a more recent experience with a major recession, could be influencing people to hoard money (i.e. curtail spending) rather than spend faster to avoid inflation’s effects.  In other words, people may currently fear recession more than they fear inflation. It is quite possible that they will get both as we saw with the 1970s “stagflation“. As we said in the Stagflation article,

“The major problem with stagflation is that the normal methods of increasing interest rates doesn’t help the situation. The only reason it helps  in times of high economic activity is because it slows the “velocity of money” or the speed at which it changes hands.”

But as we saw above, the velocity of money is already at “rock bottom,” so raising interest rates may not help. Typically, when the economy is weak the standard medicine administered by the FED is to lower interest rates to stimulate the economy.  Unfortunately, it is impossible to stimulate the economy by lowering rates while simultaneously fighting inflation by raising rates.

So, what can the FED do for Stagflation? The only real solution is to face the real problem (which isn’t interest rates at all but the money supply).  It has to reduce the money supply to get the economy back on a firm footing.

See: Aluminum, Copper, Zinc: The 3 Horsemen of the Upcoming “Econocalypse” for more information.

See Also:

  • What is Stagflation?
  • Millennials Have Never Seen Inflation This High
  • What is the Money Multiplier?
  • What is the Velocity of money?

About Tim McMahon

Connect with Tim on Google+.

  • Web
  • |
  • Twitter
  • |
  • Facebook
  • |
  • LinkedIn
  • |
  • More Posts(408)

Filed Under: Commodities Tagged With: Aluminum, commodities, Copper, Zinc

Leave a Reply Cancel reply

Your email address will not be published. Required fields are marked *

This site uses Akismet to reduce spam. Learn how your comment data is processed.

Latest Posts

  • Updated Cumulative Inflation Calculator
  • Inflation-Adjusted Silver Prices
  • December Inflation Down Slightly, Not Flat
  • December 2025 Inflation Report for November
  • How Deflation Created the Middle Class
  • October Inflation Numbers Delayed
  • Why the 2.8% COLA May Fall Short of Real Inflation
  • Delayed BLS September Inflation Data Released

Sponsored:

As a Seasoned Investor I thought I'd seen everything... But recently I discovered TradingView which has really improved the information I have at my fingertips.~ Tim McMahon, editor

TradingView gives me an edge... including powerful charting tools, real-time market data, and a global community of traders—all in one easy to use platform. It has hundreds of indicators, and even custom scripts for more advanced users, and you don't need to change Brokers just use its seamless brokerage integration... TradingView isn't just a charting tool—it's your full trading command center.

Trade smarter. Trade faster. Check Out TradingView for free.

----------

The Best Place to Buy Your Crypto

Coinbase is the largest Crypto Trading platform in the U.S. and the easiest to use. ~Tim McMahon, editor

Check out Coinbase here

Subscribe Now

eTrends Signup Form

Elliott Wave Resources

Free Elliott Wave Resources

What is Waveopedia?

Waveopedia is EWI’s free, comprehensive index of Elliott wave patterns and terms. Everyone from beginners to experts can benefit from it. It’s a great place to send your followers if they’re new to Elliott waves.

  • Deflation Hits China is the U.S. Next?

  • Why You Must Avoid the Herding Trap

  • Chasing Trends Can Cost You

  • More Education Resources

Post Archives

Home | Articles | Sitemap | Terms of Service | Privacy | Disclaimer | Advertise With Us

Copyright © 1996-2026 · Capital Professional Services, LLC · Maintained by Design Synergy Studio · Admin

Do Not Sell My Personal Information