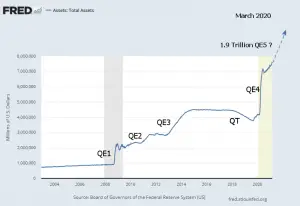
Inflation Summary: Annual Inflation up from 1.40% in January to 1.68% in February. CPI Index rose from 261.582 in January to 263.014 in February. Monthly Inflation for January was 0.43% and February was 0.55%. Next release April 13th Annual inflation for the 12 months ending in February was 1.68%, a 20% increase over January's 1.40% The CPI index itself was up from 261.582 in January to 263.014 in February. Resulting in a monthly inflation rate of 0.55% which replaced February 2020's 0.27%. Annual inflation for the 12 months ending in February was 1.68%, since the BLS rounds their numbers they report it as 1.7%. Setting the Stage for Inflation Due to the Corona … [Read more...]
March Inflation Data Released
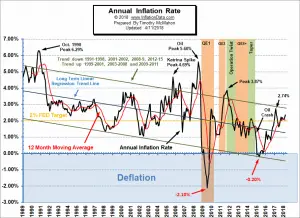
The U.S. Bureau of Labor Statistics released the Annual Inflation Rate data for the year through the end of March on April 11th 2018. Annual Inflation is Up Annual inflation rate was 2.36% up from 2.21% in February. CPI was 249.554 in March, 248.991 in February, 247.867 in January and 246.524 in December. Monthly Inflation for March 2018= 0.23% Monthly Inflation for March 2017= 0.08% Next release May 10th Monthly Inflation: Typically the monthly inflation rate is highest during the first quarter (January through March) and lowest during the last quarter (October through December). March 2018 had 0.23% monthly inflation which was below February's 0.45% but it … [Read more...]
June- First Annual Inflation for 2015
The Bureau of Labor Statistics (BLS) released their monthly Consumer Price Index (CPI-U) and Inflation report for the year ending in June on July 17th. This resulted in 0.12% Annual Inflation. The BLS rounded this to .1% which of course is so small that almost any one of the deflationary months last year would cancel out all the inflation we've seen over the previous 12 months. The CPI-U index a year ago was 238.343 and is currently an almost identical 238.638. January through May 2015 saw deflation on an annual basis although each month was inflationary in and of itself. But due to the massive deflation of the fourth quarter of 2014, all the monthly inflation was cancelled out. However, … [Read more...]
Can We Trust Government Inflation Numbers?
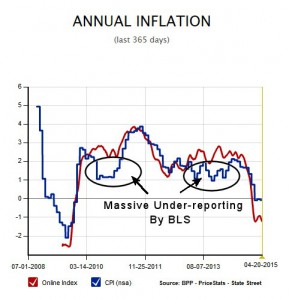
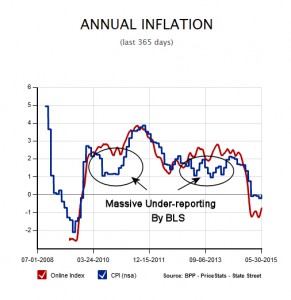
Independent Inflation Tracking Numbers Updated February 19, 2016 For some reason people don't seem to trust the government. I can't understand why. Surely the government only has our best interests at heart and wants to take care of us like good parents, and they are just protecting us from ourselves. And of course all politicians are honest, selfless, hard-working civil servants. Right? Well, Okay maybe they don't always have our best interests at heart. And maybe it would benefit the budget if they didn't have to pay so much for cost of living increases but surely they aren't fudging the Consumer Price Index are they? I frequently get emails, and occasionally phone calls, asking … [Read more...]
The Real Basket of Goods
I recently received the following from Ed Devol, "When I try to educate people about the impact of inflation, I find putting it in terms of time worked for something is a good way of explaining inflation". Thanks, Ed. I agree, when I am deciding whether to purchase something, I like to think of it in terms of how many hours I have to work to buy it. (It helps keep it "real"). In addition economists often link how many hours the average person has to work to eat. A poor country might require eight hours of work a day just to eat. While a rich country might require only 1 hour a day. So you might like the following article by Lynn Carpenter as she tracks prices and earnings over the last 60 … [Read more...]
May Inflation Surges to 3.2% in OECD Countries
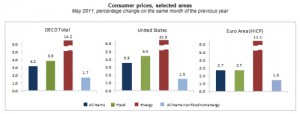
The Organization for Economic Co-operation and Development (OECD) has finished aggregating the May inflation data provided by its member countries and has released the results. Energy prices were up a whopping 14.2% for the 12 months ending in May while food prices were up by 3.9%. The overall average for all products in all the OECD countries was 3.2% in May. This was up from the 2.9% reported in April. The major components of this increase were mainly a sharp acceleration of inflation in Canada (to 3.7% in May, up from 3.3% in April) and the United States (to 3.6%, up from 3.2%) with high food and energy prices being the main drivers. The following chart breaks the components down by … [Read more...]
Does the Consumer Price Index (CPI) Include Taxes?
Question: I have heard over the years that the CPI does not include taxes as one of its components. In other words, an increase or decrease in a tax rate is not considered a change in consumer prices/costs. Is this true? If so, how is this omission justified? Thank you, James Schmidt … [Read more...]
Annual Inflation Since 1914
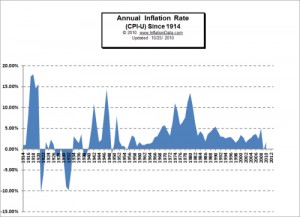
The Bureau of Labor Statistics has been tracking the Consumer Price Index (CPI-U) since 1913. Thus they have been able to calculate the Inflation rate since 1914. And over that period we have seen some major periods of both inflation and deflation as you can see from the chart. The early years (the teens) were marked by high inflation. The early 1920's started with deflation and low inflation. The 1930's of course had the Great Depression and was primarily a period of deflation. World War II ushered in times of massive government spending and nationwide austerity as commodities were rationed and most of the production was directed toward the war effort. As the G.I.s returned and wanted to … [Read more...]
How Do I Calculate the Inflation Rate?
The following article explains how to calculate the current inflation rate, if you know the Consumer Price Index. If you don't know it, you can find it here. If you don't care about the mechanics and just want the answer, use our Inflation Calculator. The Formula For Calculating Inflation The formula for calculating the Inflation Rate using the Consumer Price Index is relatively simple. Every month the Bureau of Labor Statistics (BLS) surveys prices and generates the current Consumer Price Index (CPI). Let us assume for the sake of simplicity that the index consists of one item and that one item cost $1.00 in 1984. The BLS published the index in 1984 at 100. If today that same item … [Read more...]
Inflation vs Consumer Price Index – Do you know the difference?
Many people are confused by the difference between Inflation and the Consumer Price Index. The Consumer Price Index is as its name implies an index, or “a number used to measure change”. The Consumer Price Index (CPI-U) The government chose an arbitrary date to be the base year and set that equal to 100. Currently that date is 1984. (Or more accurately the average of the years 1982-1984) previously the base year was 1967 (they change the base year every once in a while so you don't notice that there has been over 2000% inflation since the start). See Cumulative Inflation Since 1913. Every month the Bureau of Labor Statistics (BLS) surveys prices around the country for a basket of … [Read more...]

