
The Bureau of Labor Statistics reports February 2022 Inflation Hits Another Record High.
Inflation Summary:
- Annual Inflation highest since January 1982.
- CPI Index rose from 281.148 to 283.716.
- Monthly Inflation for February was 0.91%
- The next release is on April 12th
February 2022 Annual Inflation was 7.87%.
Jan. 2021 — 1.40% ** Jan. 2022 — 7.48% ** Feb. 2022 — 7.87%
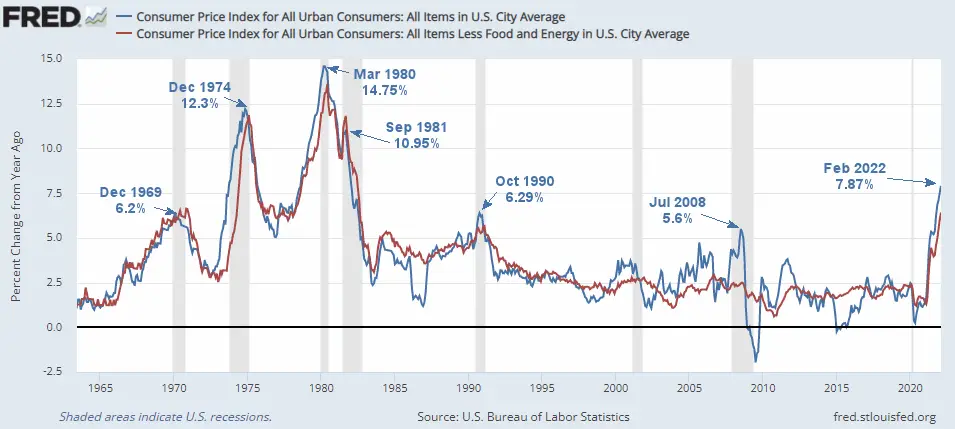
Inflation soared again in February 2022. The last time inflation was higher was in January 1982 when it was 8.39% but then it was declining from the March 1980 peak of 14.76%.
Although we calculate it to two decimal places the Bureau of Labor Statistics reported February’s inflation rate as 7.9%.
BLS Inflation Report:
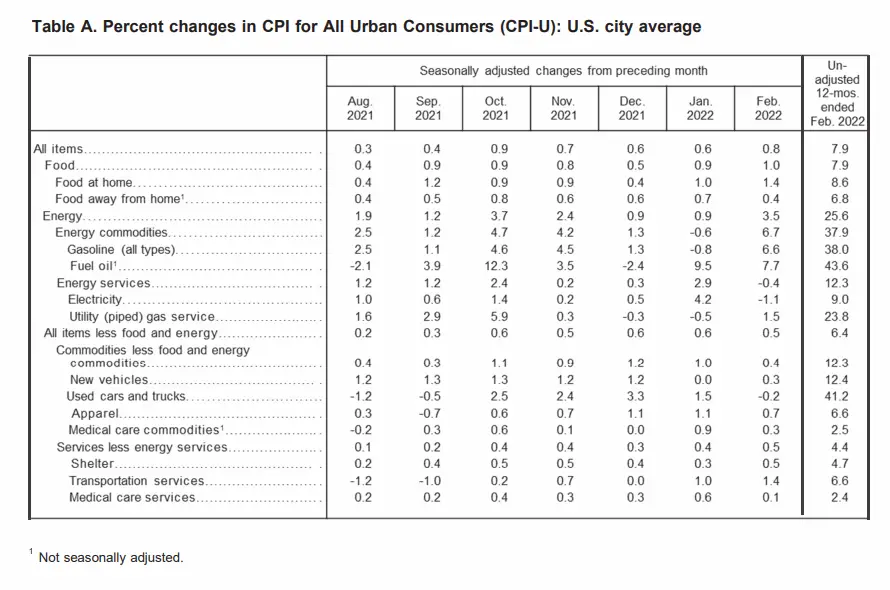
According to the BLS commissioner’s report, “The Consumer Price Index for All Urban Consumers (CPI-U) increased 0.8 percent in February on a seasonally adjusted basis after rising 0.6 percent in January, the U.S. Bureau of Labor Statistics reported today. Over the last 12 months, the all items index increased 7.9 percent before seasonal adjustment.
Increases in the indexes for gasoline, shelter, and food were the largest contributors to the seasonally adjusted all items increase. The gasoline index rose 6.6 percent in February and accounted for almost a third of the all items monthly increase; other energy component indexes were mixed. The food index rose 1.0 percent as the food at home index rose 1.4 percent; both were the largest monthly increases since April 2020.
The index for all items less food and energy rose 0.5 percent in February following a 0.6-percent increase the prior month. The shelter index was by far the biggest factor in the increase, with a broad set of indexes also contributing, including those for recreation, household furnishings and operations, motor vehicle insurance, personal care, and airline fares.”
They also say monthly inflation was 0.8% but that is on a Seasonally Adjusted basis. The unadjusted rate was 0.91%. As you can see from the table below, Used cars and Energy show the biggest increases. But food was up the same as the average for all items.
Looking at the long-term inflation chart below, current levels have exceeded the July 2008 peak of 5.6% and the October 1990 Peak of 6.29%.
 Click for Larger Image
The main reason inflation was conquered 40 years ago was because Reagan was willing to take the hard steps necessary to control it. He tasked the FED with wringing inflation out of the system which resulted in a massive recession. If we look at the chart above it appears that there are two recessions, one in 1980 and another larger one a couple of years later. But an argument can be made that it was really just one big recession knocking inflation down from 14.76% in March 1980 to 2.46% in July of 1983. This was a politically risky thing to do, since most Presidents don’t voluntarily throw the economy into recession and it cost him a lot of political capital and some are still bitter about it today.
When we ask, How Quickly Can The FED Get Inflation Under Control today? we first have to ask if the current administration has the willpower to tackle the task and also do they have the political capital to accomplish it? Another unique component of today’s inflation situation is the tight labor market Former Treasury Secretary Larry Summers discusses.
The current FED has been spoiled by declining inflation rates since the 1980 peak, allowing them to print money almost at will. This is partly due to deflationary forces resulting from innovation in the Electronics/Computer/Internet area and partly due to competition from China driving down prices. See: How Nixon’s Revolutionary Move Influenced U.S. Inflation For 50 Years for more information. For more information see: From Pandemic To 2021 Supply Chain Disruption for more information.
February 2022 Inflation Situation
The Current Annual inflation Rate for the 12 months ending in February was 7.87% up from 7.48%, in January and more than 5 times last January’s 1.4% rate.
We must remember that 7.87% is only through February! It doesn’t include the massive spike in gasoline that occurred in March. Looking at our Moore Inflation Predictor we see that 11% inflation is possible by May.
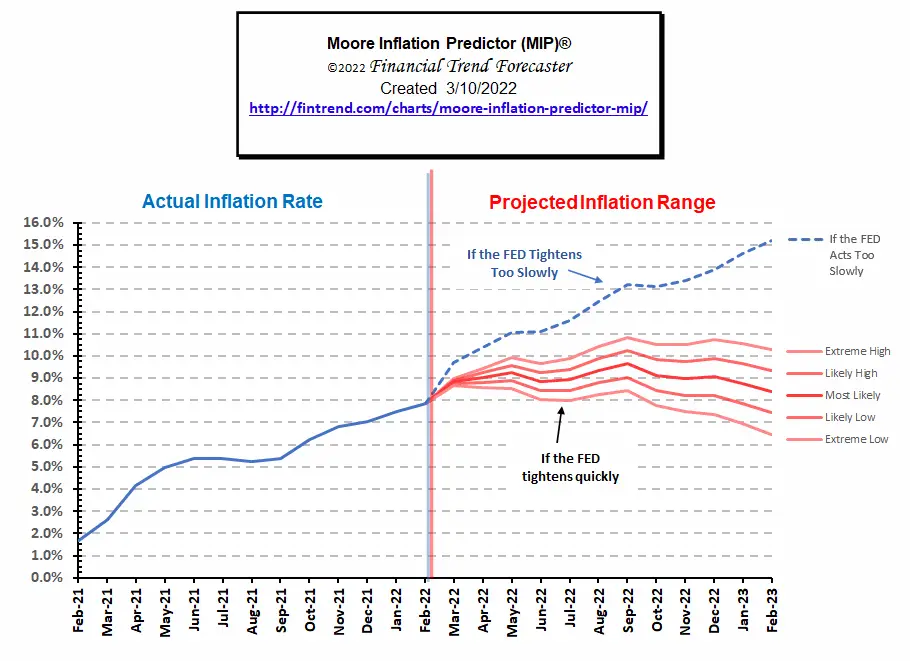
See Moore Inflation Predictor’s Forecast for more information on current projections.
Monthly Inflation:
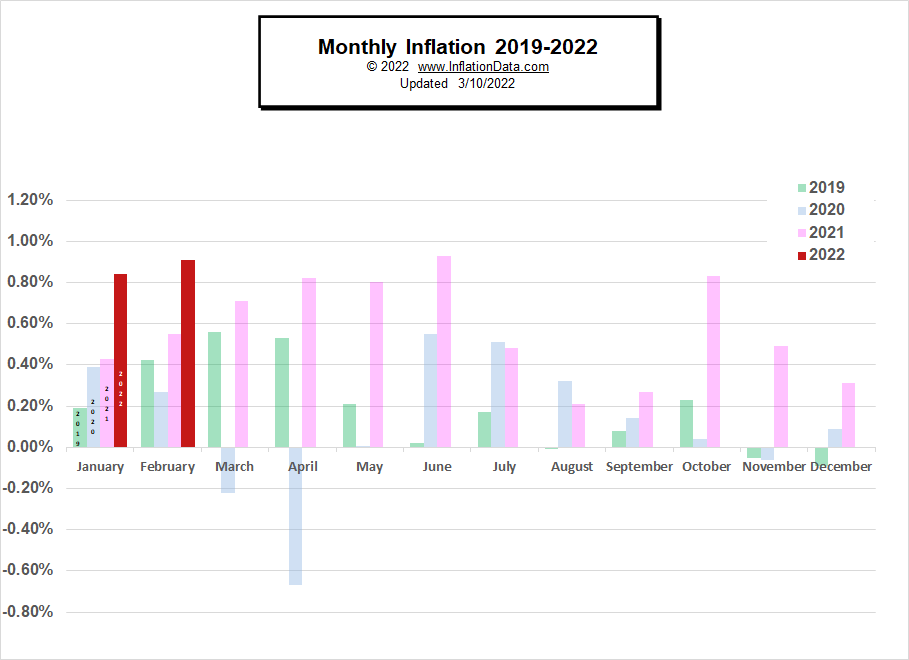
February 2021’s 0.55% monthly inflation was replaced by February 2022’s 0.91% increasing the Annual inflation rate from 7.48% to 7.87%. Back in 2021, 0.91% was almost a whole year’s inflation rather than just a single month.
Monthly inflation in 2021:
| January | February | March | April | May | June |
| 0.43% | 0.55% | 0.71% | 0.82% | 0.80% | 0.93% |
At 0.84% (January) and 0.91% (February) monthly inflation was high even for the first quarter of a year when monthly inflation is already at its highest. Typically monthly inflation from January through May, is in the 0.30% to 0.50% range. And then, in June, inflation typically starts to moderate into a lower range, and then October through December is typically very low or even negative. But, as we can see from the table above, 2021 was consistently above that range.
Note that January 2022’s 0.84% was the highest January since 1990.
Click for Larger Image
See Annual Inflation for more information.
Not Seasonally Adjusted Monthly Inflation Rates
Note: January 2022’s 0.84% was the highest January since 1990.
| Jan | Feb | Mar | Apr | May | Jun | Jul | Aug | Sep | Oct | Nov | Dec | |
| 2016 | 0.17% | 0.08% | 0.43% | 0.47% | 0.41% | 0.33% | (0.16%) | 0.09% | 0.24% | 0.12% | (0.16%) | 0.03% |
| 2017 | 0.58% | 0.31% | 0.08% | 0.30% | 0.09% | 0.09% | (0.07%) | 0.30% | 0.53% | (0.06%) | 0.002% | (0.06%) |
| 2018 | 0.54% | 0.45% | 0.23% | 0.40% | 0.42% | 0.16% | 0.01% | 0.06% | 0.12% | 0.18% | (0.33%) | (0.32%) |
| 2019 | 0.19% | 0.42% | 0.56% | 0.53% | 0.21% | 0.02% | 0.17% | (0.01%) | 0.08% | 0.23% | (0.05%) | (0.09%) |
| 2020 | 0.39% | 0.27% | (0.22%) | (0.67%) | 0.002% | 0.55% | 0.51% | 0.32% | 0.14% | 0.04% | (0.06%) | 0.09% |
| 2021 | 0.43% | 0.55% | 0.71% | 0.82% | 0.80% | 0.93% | 0.48% | 0.21% | 0.27% | 0.83% | 0.49% | 0.31% |
| 2022 | 0.84% | 0.91% |
See: Monthly Inflation Rate for more information and a complete table of Unadjusted Monthly Rates.
Federal Reserve Actions
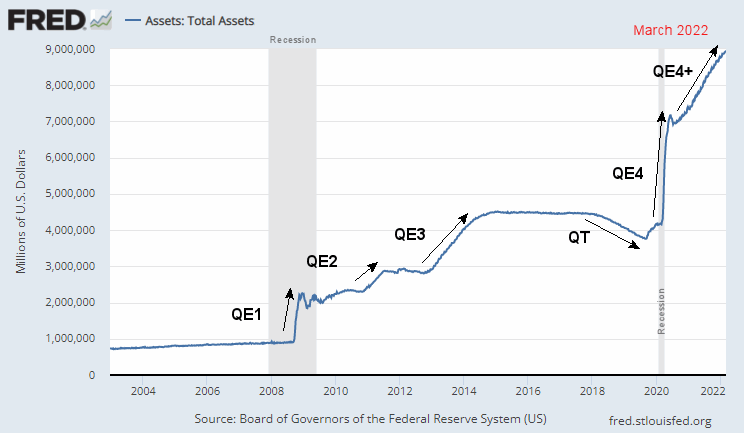
In the following chart, we see the Federal Reserve Total Assets have stair-stepped up over the last year. The FED announced that it will be ending QE4 in March. This is still NOT Quantitative Tightening or fighting inflation. It is simply letting off the gas pedal. But like any drug addict, the stock market is addicted to ever higher shots of QE so if their supply is cut off they will still crash.
Click for Larger Image
However, just letting off the gas is enough to send the stock market into a tailspin since it is like a drug addict when it comes to QE. Cut off its supply, and it gets the shakes.
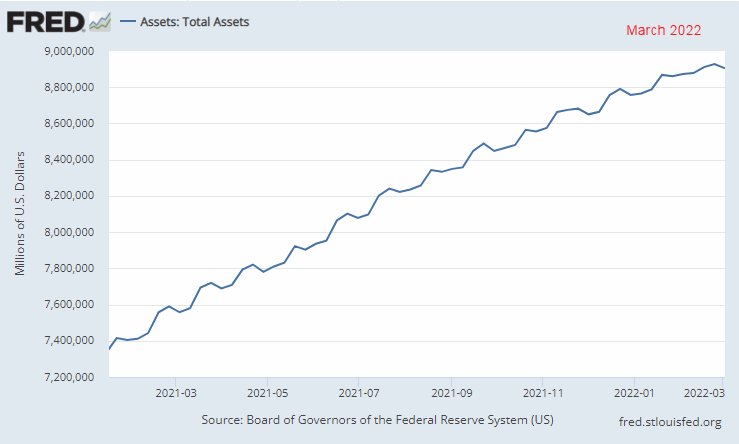
FED Assets Closeup
Looking at FED assets just over the last year, we can see how they stair-stepped up. For the first week of March, we can see a slight decline in assets but we’ve seen many of those over the last year as well. So only time will tell how the FED will actually act because often they say one thing and do something entirely different.
FED Funds Rate
So far, the FED has NOT raised interest rates to fight inflation, instead, it held the FED funds rate steady at a minuscule 8/100% (0.08%) from September through February.
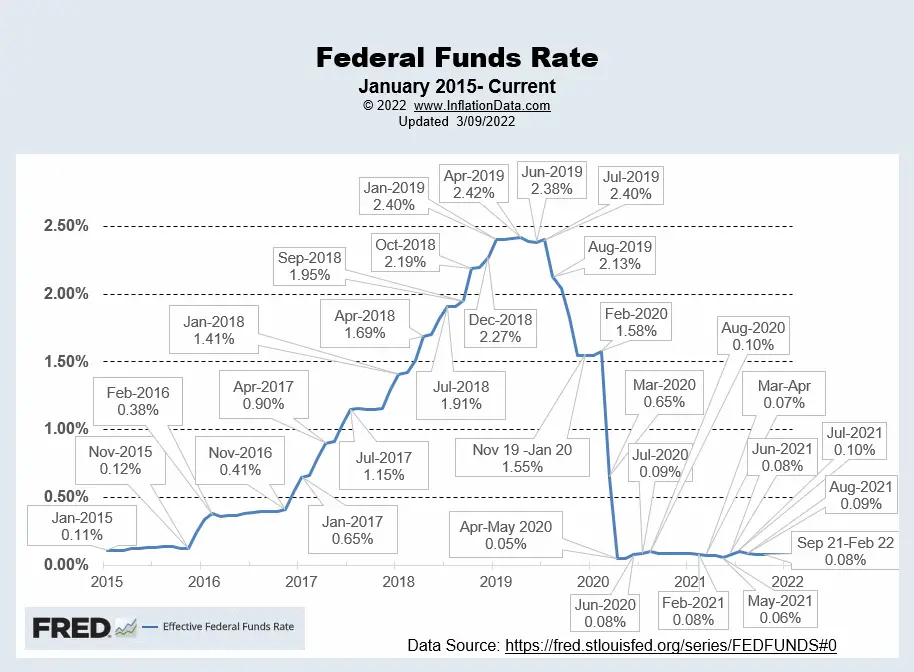
Chart Data Source St Louis FED.
For more info, See NYSE ROC and MIP.
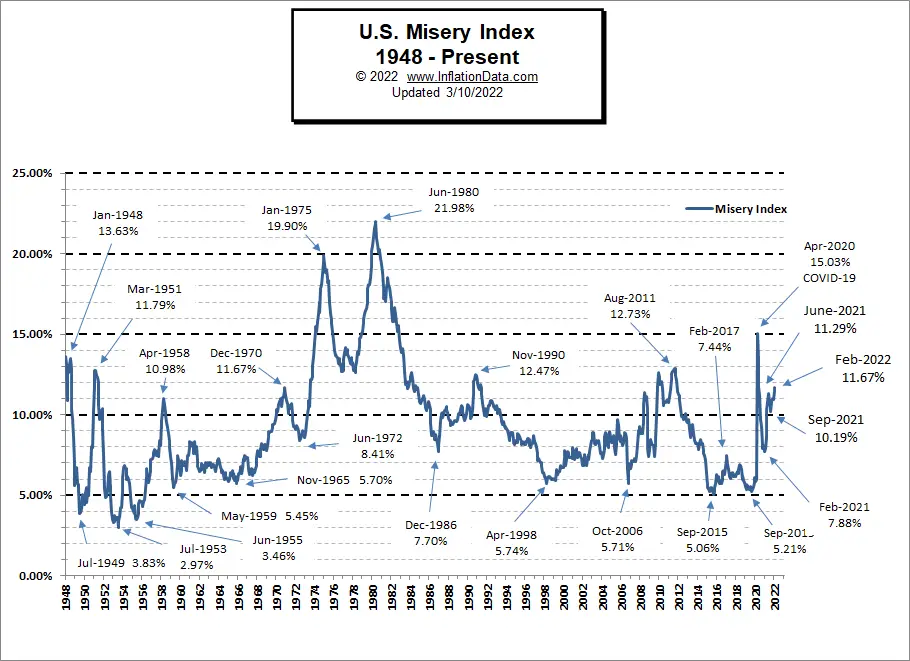
Misery Index
Even though unemployment was down, February 2022 Inflation was up more, so the Misery index increased again.
Click for Larger Image
[Read More…]
NYSE Rate of Change (ROC)©

Sell Signal
The NYSE ROC index is down below its moving average.
See the NYSE ROC for more info.
NASDAQ Rate of Change (ROC)©

Sell Signal
The NASDAQ ROC, down well below its moving average.
See NASDAQ ROC for more.
You Might Also Like:
From InflationData.com
- How Should You Invest to Benefit From Inflation?
- Hyperinflation in Turkey and Argentina Today?
- January Inflation Nears 40 Year High
- Former Treasury Secretary Larry Summers on the Current Inflation Situation
- How Quickly Can The FED Get Inflation Under Control?
- How Nixon’s Revolutionary Move Influenced U.S. Inflation For 50 Years
From UnemploymentData.com.
- February Employment / Unemployment Report
- Make Your Future With A Medical Assistant Career
- Excellent Six-Figure Careers To Consider
- Create A Great Construction Job Resume For Better Responses
From Financial Trend Forecaster
- Moore Inflation Predictor
- NYSE ROC Chart
- NASDAQ ROC Chart
- Economic Warfare Deployed Against Russia
- The Surprising Implications Of Declining Global Birth Rates
- What is Entity Extraction and Why Should You Care?
- Technology And The Semiconductor Chip Shortage
- Remarkably Quick And Easy Alternative House Building Methods
From Elliott Wave University
- Historically Investors Become “Long-term Buyers” at Precisely the Wrong Time
- Why the “60 / 40 Balance” May Be Hazardous to Your Portfolio
- Warning: Mergers And Acquisitions Can Vaporize The Stock Market
- Is the Correction Over?
- Euro: Look at This Head & Shoulders Chart Formation
From OptioMoney.com
- Guide to Managing Small Business Finances
- Unlock The Benefits Of A Good Credit Score
- Buying A Home When You Are Already In Debt
- Top 10 Tasks Businesses Should Outsource in 2022
- 7 Unexpected Costs Of Moving To A New Home
From Your Family Finances
- How to Prepare for a Monthly Mortgage Payment With Kids
- Everything you need to know about buying a car
- 8 Amazing Pros And Cons Of Living In Florida
- Practical Tips to Organize Your Finances to Buy a House
- Should You Exploit High House Prices To Pay Off Debt?

Leave a Reply