
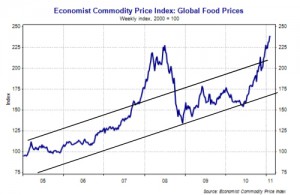
Agflation, is a relatively new term coined by analysts at Merrill Lynch in 2007. Back then rising demand for agricultural products started driving up prices. Agflation is simply a combining of the words agriculture as in "agricultural commodities" and the word inflation. Inflation is commonly used to mean an increase in prices (although it originally meant an increase in the money supply which eventually resulted in an increase in prices). So agflation is simply an increase in the prices of agricultural products. But agflation is not the result of an increase in the money supply like typical inflation, but rather it is simply a result of supply and demand factors. In 2000, the world wide … [Read more...]
How to Calculate the Social Security Cost of Living Adjustment
How Does The Government Calculate the Cost of Living Adjustment (COLA) on your retirement benefits like Social Security? I recently received the following question from Jerry: What formula does the government uses to figure out COLA based on inflation for retired people each year? That is a great question! Social Security benefits are indexed for inflation to protect beneficiaries from the loss of purchasing power due to inflation. The government uses a complex averaging system to take the average CPI index for the 3rd quarter of the previous year versus the average CPI index for the current year and calculate the inflation rate based on that. Cost of Living adjustments are … [Read more...]
Market News
Check out the latest news on the economy in this video: … [Read more...]
Annual Inflation Eases In OECD Countries- November 2010
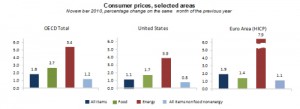
The following article from the Organization for Economic Development (OECD), shows a comparison of the inflation rates of several of the major countries. From it, we can see how the U.S. compares. Typically U.S. energy prices are lower than Euro areas and currently energy prices are rising faster there than in the U.S. as well (as we can see from the first chart). Overall inflation is also higher in other OECD countries than in the United States. The average for all OECD countries for all items is 1.8% while the inflation rate for the US was only 1.1%. It takes a few weeks longer for the OECD to compile the data so even though the November numbers were released in mid-December the … [Read more...]
U.S. Tax Burden Good News?
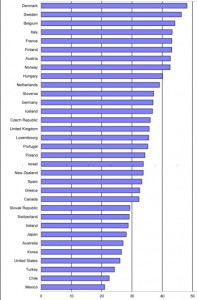
The Organisation for Economic Co-operation and Development (OECD) released its revenue statistics today and it contained some good news for residents of the United States. Well, maybe not "Good News" but "Less Bad" news. It seems that the tax burden in the United States is not as bad as it is in the majority of the other developed countries in the world. The OECD statistics show that as a percentage of GDP Denmark has the highest tax burden with the Danish government absorbing almost half of their GDP (48.2%). Sweden was a close second at 46.4%. Other European countries … [Read more...]
Education Inflation Way Above Consumer Price Index
Every year the College Board surveys 3,500 colleges across the country to determine college cost increases and trends. Then in October it releases its "Trends in College Pricing" report. Here are highlights from its latest report: In-State tuition up 7.9% Out-of State Tuition up 6% Private University Tuition up 4.5% … [Read more...]
Inflation on a 30 Year Mortgage

I recently received the following question: In 1970 I purchased a nice house in the suburbs of Albany, New York for $54,500. Although the price of the home today is well above the inflation rate, I was wondering how the inflated dollars I'm spending on the last few payments has changed over the past 30 years. The mortgage payment has been consistent but I'm paying in inflated dollars, I just don't know how much the value of each dollar has declined in purchasing power. How would I calculate that figure?- John … [Read more...]
Annual Inflation Since 1914
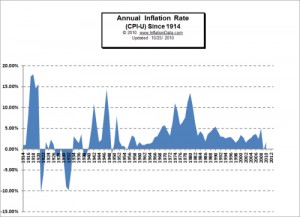
The Bureau of Labor Statistics has been tracking the Consumer Price Index (CPI-U) since 1913. Thus they have been able to calculate the Inflation rate since 1914. And over that period we have seen some major periods of both inflation and deflation as you can see from the chart. The early years (the teens) were marked by high inflation. The early 1920's started with deflation and low inflation. The 1930's of course had the Great Depression and was primarily a period of deflation. World War II ushered in times of massive government spending and nationwide austerity as commodities were rationed and most of the production was directed toward the war effort. As the G.I.s returned and wanted to … [Read more...]
M3 Money Supply Numbers are Back- Sort Of
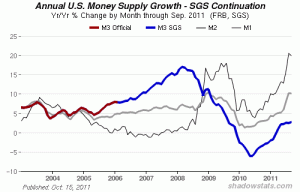
Back in March of 2006 I told you the U.S. Government was hiding something and that something was the growth in the money supply as measured by M3. Back then the Federal Reserve tracked and published the money supply measured three different ways-- M1, M2, and M3. Each of these three money supply measures track slightly different views of the money supply. The most restrictive, M1, only measures the most liquid forms of money; it is limited to currency actually in the hands of the public. This includes checking accounts travelers checks, and other deposits against which checks can be written. Of course the money supply is much bigger than that. What about savings accounts? M2 … [Read more...]
Get Your Free Report: How to Use Bar Patterns to Spot Trade Setups
Greetings reader, Our friends at Elliott Wave International, the world’s largest market forecasting firm, have just updated their free report, How to Use Bar Patterns to Spot Trade Setups. With thousands of downloads, “Bar Patterns” has always been a huge hit with traders. But now it’s been packed with even more ways you can use common bar patterns to spot high-probability trading opportunities: 30 charts across 15 pages! Don’t miss out on this opportunity to learn simple new ways to spot valuable trade setups in the charts you view every day. Download Your Free Bar Patterns Report. … [Read more...]
