This is an interesting question. How long DOES it take to get inflation under control? I’ve often said that the economy is like a cruise ship; it doesn’t turn on a dime. A cruise ship can’t just come barreling into the harbor at full speed and slam on the brakes when it’s near the dock. If it tried that, it would end up destroying half the town.
Typically, it takes AT LEAST 9 months for the economy to see the effects of the FED’s actions. In order to control inflation, a successful FED has to anticipate where the economy will be nine months to a year down the road and then take measured steps to correct it before we get there. We haven’t seen that this time. What we have seen is a FED in denial that their massive money creation scheme had any effect and instead they blamed the increase in inflation on “transitory” factors like COVID supply disruptions.
We’ve been saying that inflation would be an issue for about a year now, while the FED only acknowledged the possibility a couple of months ago. And even then, they were dragging their feet on trying to control it.
Over the last decade, the FED was lulled into a false sense of security by extrinsic factors that have kept inflation low despite their massive money printing. So they deluded themselves into thinking that they could print money with abandon and never suffer the consequences. But the chickens have finally come home to roost.
Historical Inflation Factors
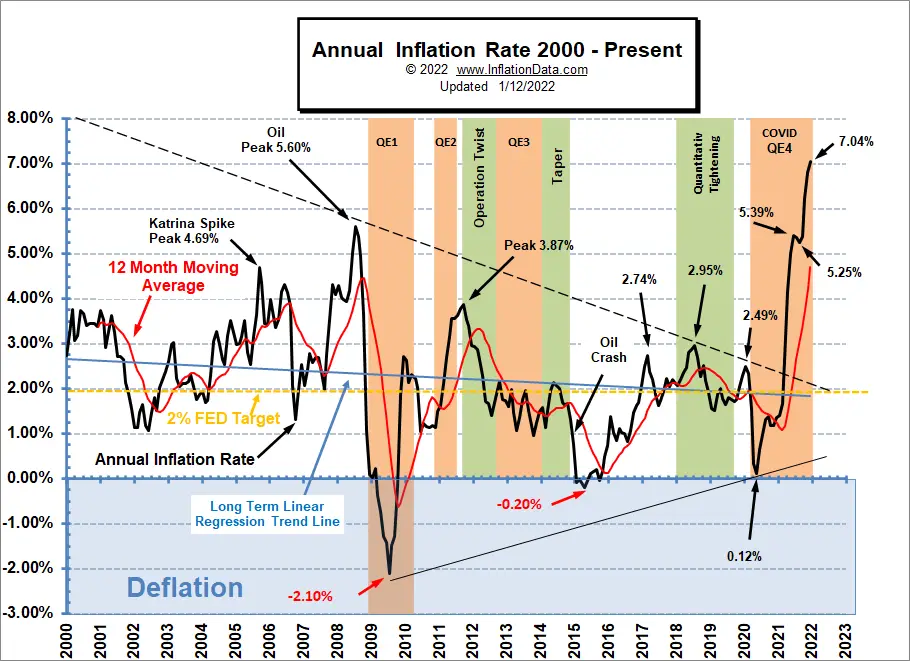
As we can see in the chart below, Nixon was President the last time inflation started to be a problem. This chart only shows the average inflation rate for the entire year. We need to remember that peak inflation was much higher than average inflation. So, just like the average for all of 2021 was “only” 4.69%, the peak was 7.04%. But the averages smooth out the chart making the trend easier to see.
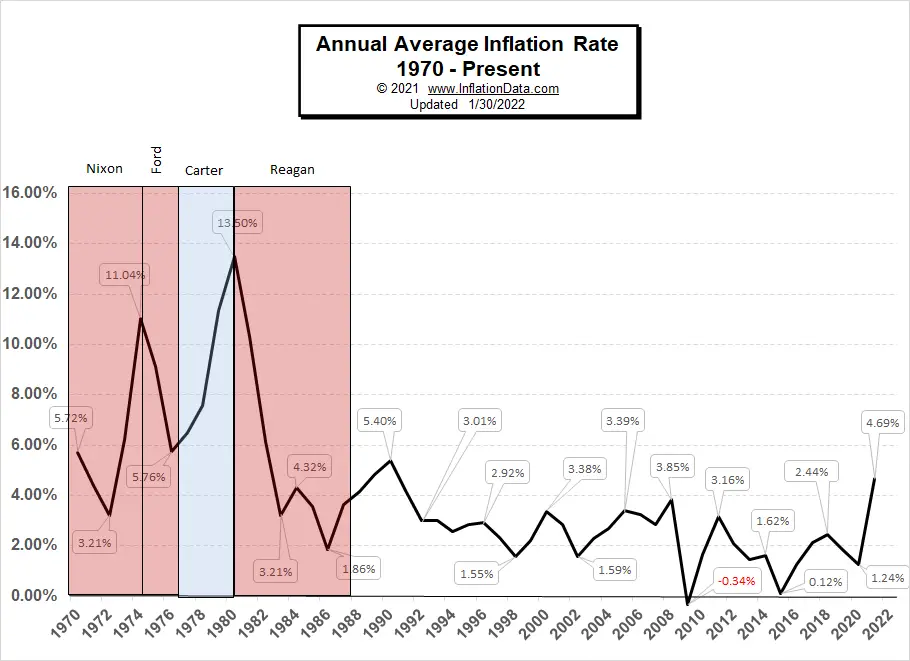
In the 1970s, Keynesian economics was all the rage because it gave the government the green light to print all the money it wanted. (Although John Maynard Keynes also said that the government should decrease the money supply at certain times. Unfortunately, that part never seems to be popular with politicians. And Nixon was a Keynesian, so the money supply grew, and inflation got out of control. I’ve said before that I think one of the reasons that Nixon got such a bad rap (despite being re-elected in a landslide) was because inflation was so high and the economy was in shambles.
After Nixon resigned in disgrace, Gerald Ford decided to fight rising inflation with ‘WIN’ (i.e., ‘Whip Inflation Now’). As the chart shows, he had a little success but not enough to get him re-elected since Jimmy Carter vowed to fix Ford’s inflation problem. But as we can see, the exact opposite happened. Carter also promised to eliminate the federal deficit, which would have done a lot toward fighting inflation. Instead, the deficit increased from $27.7 billion in 1979 to nearly $59 billion in 1980, and the average annual inflation rate hit 13.5%, with the peak inflation rate of 14.76%.
And that is where our lesson on fighting inflation begins.
Reagan’s Fight to Get Inflation Under Control
Unlike Nixon (and Carter), Reagan was not a Keynesian but a follower of the “Austrian School of Economics” created by economists like Friedrich Hayek, Milton Friedman, and Ludwig von Mises. The Austrian School believes that money printing has consequences, i.e., inflation, market distortions, and “there’s no such thing as a free lunch”. So, when Ronald Reagan became president in 1981, he told Federal Reserve Chairman Paul Volcker to get inflation under control no matter how painful. The “FED” raised interest rates into double digits to “wring” inflation out of the economy, driving mortgages rates into the high teens.
It’s interesting to note that one of Nixon’s actions began reaping the unintended consequence of “semi-permanently” lowering inflation by allowing us to export inflation to China. By opening trade with China which was closed until then, Nixon allowed Americans to buy cheap products from China which lowered our costs (at the expense of U.S. jobs). Lower costs, by definition, mean lower inflation, even though the FED is printing more currency since much of that excess gets shipped overseas and never returns.
But Reagan and Volcker’s actions are what got the ball rolling. Reagan’s approach was unusual and politically courageous since voters tend to punish sitting presidents for economic recessions, but Reagan did what had to be done. He displayed leadership and ultimately won reelection with a landslide in 1984.
What We Learned from Experience
It took over three years of dogged determination and high-interest rates to knock inflation from its peak of 14.76% in March of 1980 down to 2.46% in July of 1983. So the first question before we can answer, “how long will it take this time around?” is “Does the current administration have the political capital to endure a massive recession?” If the answer is yes… can they stick to it for a couple of years?
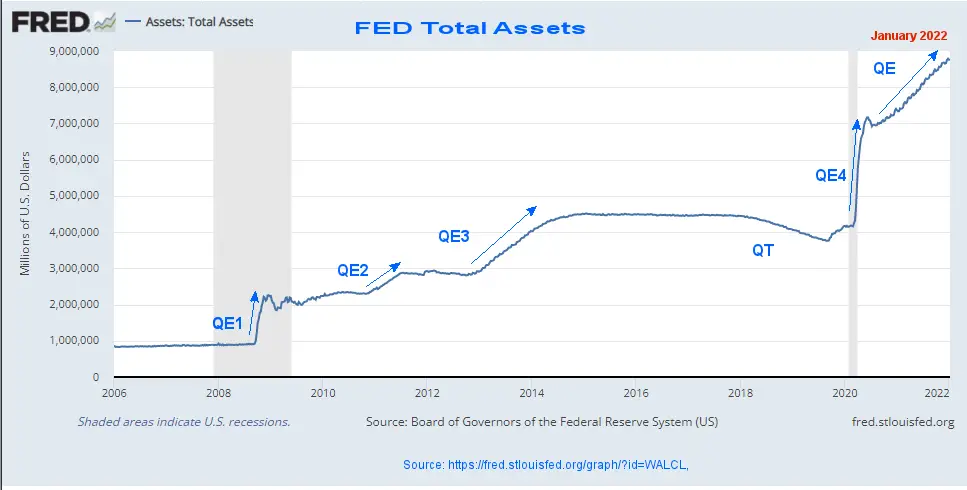
Apparently, the FED has finally decided to try to get inflation under control after getting the green light from the Biden administration in December. They intend to stop inflating, i.e., quantitative easing, at the end of February and are currently forecasting three interest rate hikes for 2022. Does this sound like the drastic measures taken by Reagan? Not really. But then inflation is presently only half of the peak that Reagan had to deal with. Will this be enough to tame the inflation beast, or will it only serve to level out inflation at current levels? That is a question still to be answered. FED assets have climbed drastically for the last two years, so money creation is already baked into the cake. If it takes nine months to see the effects and FED assets remain level beginning March 1, 2022, it would still take through the end of November before the impact of the money already created is felt. That would mean inflation could continue to rise for a while.
Conclusion:
When we ask, “How long will it take?” we need to know how hard the FED is going to try. If they were willing and able to invest the political capital that Reagan did in 1980, they could probably get it under control within a year to 18 months. But with a 33% approval rating, they don’t have that much political capital. But they may not have any choice. Biden realizes that inflation is a millstone around his neck as his “hot mike” comment about Peter Doocy shows. He knows it is a political liability, but with the mid-term elections only months away, can he do anything about it in time? And does he understand the economic consequences of fighting inflation?
Our current Moore Inflation Predictor shows inflation could be in the 5.5% range by the election if the FED actually acts. But only time will tell.
Will 5.5% make the electorate happy? Probably not. Remember, Gerald Ford couldn’t get re-elected with a 5.76% average annual inflation rate. History has shown that anything over 5% worries consumers. Perhaps if the historical deflationary factors kick back in, we will see 2% again by the 2024 election. But it is also possible that, as we show in our annual inflation charts, the long-term downtrend is over, and we have entered a new long-term upward trend. That doesn’t mean inflation won’t fluctuate, but it may fluctuate around a much higher level.
Have the Deflationary Forces ended?
- How Nixon’s Revolutionary Move Influenced U.S. Inflation For 50 Years
- Price Controls on Gas- Bad Idea
- How Does a Country Export its Inflation?
- Millennials Have Never Seen Inflation This High
- Why Quantitative Easing is Inflationary…
- Federal Reserve History: Recession of 1981-82

Leave a Reply