
Banks have $2.5 trillion parked in “excess reserves”. This is money on deposit with the FED. The FED pays a miniscule amount of interest on these reserves but the banks are willing to loan it to the FED because it is easy no risk income. But it is also the reason that the money multiplier is falling! And when the money multiplier is falling the FED has a very hard time increasing the money supply. So if the FED really wants to increase the money supply all it has to do is decrease the interest rate it pays on excess reserves and the banks will find some place else to deploy it. Which could trigger massive inflation. ~Tim McMahon,editor
A Fed Policy Change That Will Increase the Gold Price
By Doug French, Contributing Editor
 For investors having an interest in the price of gold, the catalyst for a recovery may be in sight. “Buy gold if you believe in math,” Brent Johnson, CEO of Santiago Capital, recently told CNBC viewers.
Johnson says central banks are printing money faster than gold is being pulled from the ground, so the gold price must go up. Johnson is on the right track, but central banks have partners in the money creation business—commercial banks. And while the Fed has been huffing and puffing and blowing up its balance sheet, banks have been licking their wounds and laying low. Money has been cheap on Wall Street the last five years, but hard to find on Main Street.
Professor Steve Hanke, professor of Applied Economics at Johns Hopkins University, explains that the Fed creates roughly 15% of the money supply (what he calls “state money”), while the banks create “bank money,” which is the remaining 85% of the money supply.
Higher interest rates actually provide banks the incentive to lend. So while investors worry about a Fed taper and higher rates, it is exactly what is needed to spur lending, employment, and money creation.
The Fed has pumped itself up, but not much has happened outside of Wall Street. However, the Federal Open Market Committee (FOMC), during their October meeting, talked of making a significant policy change that might unleash a torrent of liquidity through the commercial banking system.
Alan Blinder pointed out in a Wall Street Journal op-ed that the meeting minutes included a discussion of excess reserves and “[M]ost participants thought that a reduction by the Board of Governors in the interest rate paid on excess reserves could be worth considering at some stage.”
Blinder was once the vice chairman at the Fed, so when he interprets the minutes’ tea leaves to mean the voting members “love the idea,” he’s probably right. Of course “at some stage” could mean anytime, and there’s plenty of room in the word “reduction”—25 basis points worth anyway. Maybe more if you subscribe to Blinder’s idea of banks paying a fee to keep excess reserves at the central bank.
Commercial banks are required a keep a certain amount of money on deposit at the Fed based upon how much they hold in customer deposits. Banking being a leveraged business, bankers don’t normally keep any more money than they have to at the Fed so they can use the money to make loans or buy securities and earn interest. Anything extra they keep at the Fed is called excess reserves.
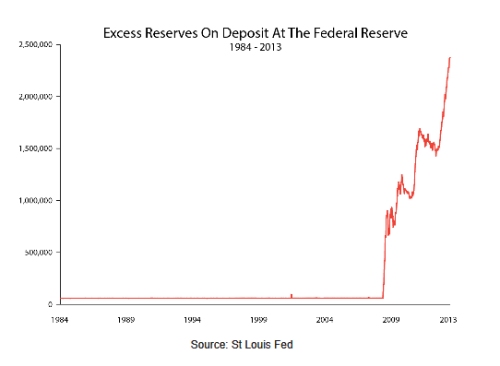
Click for Larger Image
Up until when Lehman Brothers failed in September of 2008, excess reserves were essentially zero. A month later, the central bank began paying banks 25 basis points on these reserves and five years later banks—mostly the huge mega-banks—have $2.5 trillion parked in excess reserves.
I heard a bank stock analyst tell an investment crowd this past summer the banks don’t really benefit from the 25 basis points, but we’re talking $6.25 billion a year in income the banks have been receiving courtesy of a change made during the panicked heart of bailout season 2008. This has been a pure government subsidy to the banking industry, and one the public has been blissfully ignorant of.
But now everything looks rosy in Bankland again. The banks collectively made $36 billion in the third quarter after earning over $42 billion the previous quarter—showing big profits by reserving a fraction of what they had previously for loan losses.
The primary regulator for many banks—the FDIC—is even cutting its operating budget 11%, citing the recovery of the industry. The deposit insurer will have one short of 7,200 employees on the job in 2014.
That’s a third of the number it had in 1991 after the S&L crisis, but almost 3,000 more than it had in 2007 just before the financial crisis.
So with all of this good news, the Fed may indeed be thinking they can pull out the 25bp lifeline and the banks will be just fine. What Blinder thinks and hopes is the banks will use that $2.5 trillion to make loans. After all, one-year Treasury notes yield just 13 basis points, while the two-year only kicks off 31bps. Institutional money market rates are even lower.
Up until recently, banks haven’t been active lenders. The industry loan-to-deposit ratio reflects a tepid loan environment. During the boom, this ratio was over 100%. Now it hovers near 75%. It turns out that what the Fed has been paying—25 basis points—has been the best source of income for that $2.5 trillion.
However, banks won’t be able to cut their loan loss reserves to significant profits for much longer. Loan balances have grown at the nation’s banks the last two quarters and this will have to continue. If the Fed stopped paying interest on excess reserves and bank lending continues to increase, those $2.5 trillion in excess reserves could turn into multiples of that in money creation.
Banks create money when they lend. As Blinder explains, Fed-injected reserves are lent “creating multiple expansions of the money supply and credit. Bank reserves were called ‘high-powered money’ because each new dollar of reserves led to several additional dollars of money and credit.”
Fans of the yellow metal, like Mr. Johnson who sees the price going to $5,000 per ounce, have likely been too focused on the Fed’s balance sheet when it’s the banks that create most of the money.
When the Fed announces it won’t pay any more interest on excess reserves, and banks start lending in earnest again, the price of gold will be very interesting to watch.
And when that happens, you’ll want to be prepared. Find out all you need to know about the best ways to invest in gold—in the FREE 2014 Gold Investor’s Guide. Click here to read it now.
This article was written by By Doug French, Contributing Editor for Casey Research and reprinted by permission.
Image courtesy of Stuart Miles / FreeDigitalPhotos.net.

Leave a Reply