• Home
  • Related Sites
    • Financial Trend Forecaster
      • Moore Inflation Predictor
      • NYSE Rate of Change (ROC)
      • NASDAQ Rate of Change (ROC)
      • Crypto ROC- BTC & ETH
    • Unemployment Data
      • Historical Employment Data
      • Unemployment Rate Chart
      • Labor Force Participation Rate
    • Optio Money
    • Elliott Wave University
    • More Resources
  • Definitions
    • What is Inflation?
    • What is Core Inflation?
    • Inflation vs CPI
    • What is Deflation?
    • What is Disinflation?
    • What is Agflation?
    • What is Stagflation?
    • What is Hyperinflation?
    • What is Quantitative Easing?
    • What is Quantitative Tightening?
    • What is Velocity of Money?
    • What is Fiat Currency?
    • How Do I Calculate Inflation?
    • What are “Sticky Prices” and Why Do They Matter?
  • Featured Content
  • About Us
  • Feedback
    • Sitemap
  • Subscribe Now

InflationData.com

Your Place in Cyber Space for Inflation Data

CPI Index

CPIWidgetSept25
  • Numerical Inflation Data
    • Current Inflation Rate
    • Monthly Inflation Rate
    • Historical U.S. Inflation Rates
    • Historical CPI
  • Inflation Charts
    • Ann. Inf. Rate Chart
    • Long Term Inflation >
      • Ave. Inf. by Decade
      • Total Inf. by Decade
      • Inflation 1913-1919
      • Inflation 1920-1929
      • Inflation 1930-1939
      • Inflation 1940-1949
      • Inflation 1950-1959
      • Inflation 1960-1969
      • Inflation 1970-1979
    • Cumulative Inflation
    • FED Monetary Policy and Inflation
    • Inflation and Recession
    • Confederate Inflation (1861 – 1865)
    • Misery Index
    • The 3 Stages of Inflation
    • 15-Yr Inflation Trends Chart
  • Inflation Calculators
    • Cumulative Inf. Calc.
    • How Much Would it Cost
    • Salary Inf. Calc.
    • Cost of Living Calc.
    • U.K. Inf. Calc.
    • Cost of Gas Calc.
    • Net Worth Calc.
    • Lifetime Earnings Calc.
    • Savings Goal Calc.
    • Financial Calculators
  • Inf. Adjusted Prices
    • Energy >
      • Inflation Adj. Gas Prices
      • Historical Oil Prices Chart
      • Crude Oil Price (Table)
      • Natural Gas Prices
      • Electricity Prices
      • Oil vs Gold
    • Gold >
      • Inflation Adjusted Annual Average Gold Prices
      • Gold is a “Crisis Hedge” not an  “Inflation Hedge”
      • Comparing Oil vs. Gold
    • Corn Prices
    • Education Inflation
    • Housing Prices
    • Mortgage Rates
    • NYSE Index
    • Inf. Indexed Bonds
    • Movie Revenues
    • Inflation-Adjusted Wages
  • Cost of Living
    • Calculate Cost of Living
    • Cost-of-living Adj. (COLA)
    • Consumer Price Index CPI
      • Historical CPI
      • Current CPI
      • CPI Release Dates
    • Gas Prices >
      • Cost of Gas
      • Cost of Gas Per Month
      • Gas vs. Oil Price Chart
    • Food Prices 1913 vs 2013
    • Health Insurance
  • Blog
    • Key Inflation Articles
    • International Inflation
    • Historical Inflation Rates for Japan (1971 to 2014)
You are here: Home » oil » Page 2

Inflation UP, CPI Down for November

Published on December 16, 2015 Updated on March 31, 2021 by Tim McMahon Leave a Comment

Annual Inflation chart

The Bureau of Labor Statistics (BLS) released their inflation numbers for the year ending November 30th on December 15, 2015. The Consumer Price Index (CPI-U) for November was 237.336 down from 237.838 at the end of October so overall prices declined -0.21% over the month but Annual Inflation was still up 0.50% (or ½%) for the year.  This is the 4th month in a row where prices are lower than the previous month. In the table below we can see that last November the CPI was at 236.151. Then prices fell through January peaked in July and then fell to current levels. Month CPI-U Index Monthly Inflation Annual … [Read more...]

Filed Under: Inflation Tagged With: CPI, CPI-U, gas, inflation, November, oil

Are Oil Companies Ripping us off with Gas Prices?

Published on December 13, 2015 by Tim McMahon Leave a Comment

Crude Oil vs Gasoline Prices

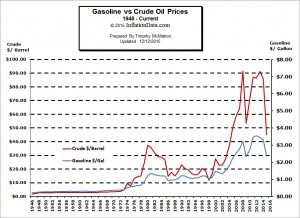
With the steady decline in gasoline prices during 2015 people aren't too concerned with the price of gas anymore. But on occasion crude oil prices have fallen without the corresponding decline in gasoline prices. When this occurs someone always asks me if the prices are actually correlated or are the oil companies just ripping us off. This prompted me to create a chart comparing the price of crude oil to that of gasoline so you can see for yourself how well they correlate and I recently updated that chart. See the full article here: Gasoline vs. Crude Oil Prices. You might also enjoy:  Are Low Crude Oil Prices a “Boom Or A Curse” For The World Economy? Includes: Top 10 Crude … [Read more...]

Filed Under: Inflation Tagged With: gasoline, inflation, oil

Annual Inflation Below 1%

Published on January 16, 2015 Updated on March 31, 2021 by Tim McMahon Leave a Comment

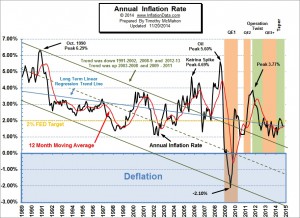
The U.S. Bureau of Labor Statistics released their monthly Consumer Price Index (CPI) data on Friday January 16th for December and for the first time since 2009 reported annual inflation below 1% (although we calculated October 2013 at 0.96%). The Consumer Price Index (CPI) for December was 234.812 down from November’s  236.151 which was also down from 237.433 for October. This resulted in a monthly decrease in prices of -0.57% and an annual inflation rate of 0.76%. Overall energy on a “seasonally adjusted” basis was down -4.7% for the month and  -10.6% on an unadjusted basis for the entire year.  Fuel oil fell -7.8%  for the month (adjusted) and a whopping -19.1% annually. Gasoline was … [Read more...]

Filed Under: Inflation Tagged With: gold, inflation, oil, stock market

Bureau of Labor Statistics: Inflation Down

Published on December 18, 2014 Updated on March 31, 2021 by Tim McMahon Leave a Comment

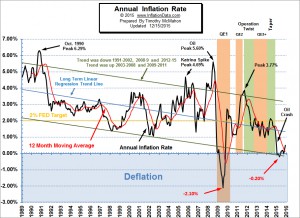
The U.S. Bureau of Labor Statistics released their monthly Consumer Price Index (CPI) data on Wednesday December 17th for November and reported lower inflation. The CPI for November was 236.151 down from 237.433 for October. This resulted in a monthly decrease in prices of -0.54% and an annual inflation rate of 1.32% down from 1.66% in October. View the chart and read the full commentary on the current annual inflation rate. Although the FED has been targeting a 2% annual inflation rate, rates are currently much lower and have often been considerably higher than 2% as well. The FED has hit their 2% target a total of 6 times out of more than 300 data points. If we count all the … [Read more...]

Filed Under: Inflation Tagged With: CPI. annual Inflation, gas, oil

Crude Oil and Gold

Published on December 17, 2014 Updated on February 9, 2015 by Tim McMahon 1 Comment

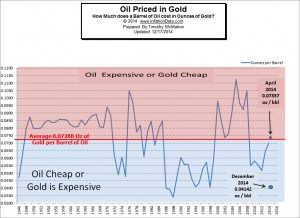
Because inflation decreases the value of of money, in order to have a “yard stick” of constant value it is necessary to use the inflation adjusted price when we consider the price of a commodity like Oil. Here at InflationData we have provided a variety of charts of the inflation adjusted price of commodities like Oil, Gasoline, Electricity, Natural Gas, Stock Market, Housing Prices, Education Costs and much more. But each of these requires you to rely on potentially flawed inflation statistics generated by some outside agency or government. If that agency has an agenda other than accuracy your cost estimates could be flawed. But there is an alternative and that is to compare your … [Read more...]

Filed Under: Energy Tagged With: gold, Inflation Adjusted Price, oil

Energy Inflation- Oil and Gas Inflation

Published on July 22, 2010 Updated on February 17, 2014 by Tim McMahon 6 Comments

By Tim McMahon, editor It is extremely difficult to decide how over or under priced a commodity is when the scale we are comparing it to is constantly changing. By adjusting for inflation we can see what is happening to the price much easier. It pays to know what prices are in "Inflation Adjusted Terms".    Once we adjust the gasoline price for inflation we can see that the average price for a gallon of gas since 1918 in June 2010 dollars is $2.39.  So it is easy to tell whether gas is currently "cheap" or "expensive". For instance, the Annual Average gasoline price for 2009 was $2.34, which was extremely close to the long term average price of $2.39. While in 2008 the annual average … [Read more...]

Filed Under: Inflation Tagged With: crude, crude oil, gas, gas inflation, inflation adjusted price of gas, inflation adjusted price of oil, oil, oil inflation

Oil and Price Inflation

Published on January 16, 2008 Updated on February 1, 2014 by Tim McMahon 2 Comments

I recently received the following question from a student in Malaysia.  I thought it was a good question so I am including it here. Dear Sir, Greetings, I am a student of  International Islamic School Malaysia, Kuala Lumpur. I hope you are well. I am in grade 10 and I take business studies as one of my subjects. Recently I  had a class on inflation in my school. The teacher said when fuel prices alone rises we cannot term that as inflation. I disagree with that because I think that rising fuel price is the only exception where we can say that it is inflation. When fuel prices increase the price of all other commodities increase ... please tell me if  it is right or wrong to say that … [Read more...]

Filed Under: Deflation, Energy Tagged With: oil, price inflation

« Previous Page

Latest Posts

  • How Deflation Created the Middle Class
  • October Inflation Numbers Delayed
  • Why the 2.8% COLA May Fall Short of Real Inflation
  • Delayed BLS September Inflation Data Released
  • September CPI Data Delay Causes Social Security COLA Concerns
  • August 2025 Inflation Report
  • Is the FED Getting Soft on Inflation?
  • July Inflation Report

Sponsored:

As a Seasoned Investor I thought I'd seen everything... But recently I discovered TradingView which has really improved the information I have at my fingertips.~ Tim McMahon, editor

TradingView gives me an edge... including powerful charting tools, real-time market data, and a global community of traders—all in one easy to use platform. It has hundreds of indicators, and even custom scripts for more advanced users, and you don't need to change Brokers just use its seamless brokerage integration... TradingView isn't just a charting tool—it's your full trading command center.

Trade smarter. Trade faster. Check Out TradingView for free.

----------

The Best Place to Buy Your Crypto

Coinbase is the largest Crypto Trading platform in the U.S. and the easiest to use. ~Tim McMahon, editor

Check out Coinbase here

Subscribe Now

eTrends Signup Form

Elliott Wave Resources

Free Elliott Wave Resources

What is Waveopedia?

Waveopedia is EWI’s free, comprehensive index of Elliott wave patterns and terms. Everyone from beginners to experts can benefit from it. It’s a great place to send your followers if they’re new to Elliott waves.

  • Deflation Hits China is the U.S. Next?

  • Why You Must Avoid the Herding Trap

  • Chasing Trends Can Cost You

  • More Education Resources

Post Archives

Home | Articles | Sitemap | Terms of Service | Privacy | Disclaimer | Advertise With Us

Copyright © 1996-2025 · Capital Professional Services, LLC · Maintained by Design Synergy Studio · Admin

Do Not Sell My Personal Information