
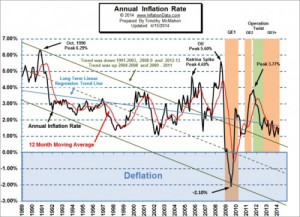
The current CPI for the month of April was 237.072 which resulted in monthly inflation being up 0.33% in the month of April causing the annual inflation rate to jump from 1.51% up to 1.95%. Last month we told you to be aware that this month's jump would be seen as a possible return to inflation and of course the main stream media and even some of our competitors fell right into that trap. USInflationCalculator for instance quoted the Wall Street Journal as saying, "Inflation may be normalizing a bit faster than we thought," the Wall Street Journal quoted Laura Rosner, U.S. economist at BNP Paribas. "It’s still too early to assume this will persist, but it certainly raises the risks of … [Read more...]
Cost of Living- Infographic

Over the years prices have changed (generally getting higher except possibly for technology devices). But it is difficult to track the changes if the length of the ruler is constantly changing. You need to compare it to a constant measurement. When that comes to calculating the cost of things, in order to get an idea of how prices are doing you need to adjust them for inflation. That is called measuring "constant dollars". Typically the calculation is based on the CPI or Consumer Price Index. In today's infographic created by our friends at Vouchercloud we will look at how things are doing in the ten years since 2003. … [Read more...]
Monthly Inflation Jumps for March 2014
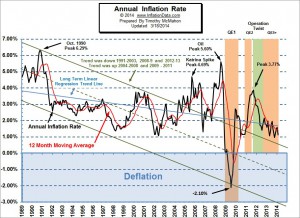
The current CPI for the month of March was 236.293 which resulted in monthly inflation being up 0.64% in the month of March causing the Annual inflation rate to rebound from 1.13% up to 1.51% nearly reaching January's 1.58%. And the Moore Inflation Predictor's inflation forecast is for another huge jump this month taking the inflation rate to over 2%. In other news: We are in the process of upgrading and redesigning the site in an effort to make it easier to use and as my webmaster says "more responsive" which means that if you have a tablet or even a smart phone you should be able to read it easier. If you are on a full sized screen and want to see what happens you can drag the side of … [Read more...]
Is the Federal Reserve Right About Inflation?

The Federal Reserve The Federal Reserve serves as the Central Bank of the United States, and whether you realize it or not, it plays an active role in the lives of every American. It makes decisions about monetary policy and interest rates that have a direct impact on the market and an indirect impact on everyone. The FED uses inflation targets to determine how much they can devalue (inflate) the currency. Many people believe that they created a massive money printing scheme cryptically called "Quantitative Easing"since QE1 converted almost worthless mortgage backed securities into currency. The Fed regularly issues statements about how inflation isn't really as bad as everyone says it … [Read more...]
Annual Inflation Down in February
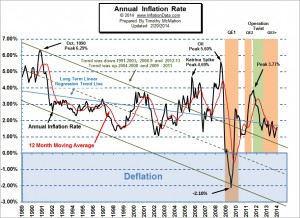
Current Inflation Commentary- The U.S. Bureau of Labor Statistics has released the Annual Inflation rate today. For the year ending in February, inflation was 1.13% down roughly 1/3rd from 1.58% for the year ending in January. Monthly inflation was relatively high at 0.37% in January and the same again in February. This is consistent with the historical trend of low inflation in the 4th quarter and high inflation in the first quarter of the year. Click for larger image The Consumer Price Index came in at 234.781 in February which was … [Read more...]
What is the Misery Index?
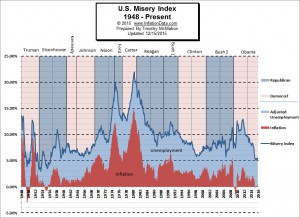
The misery index was created by economists in an effort to quantify how bad the economy is based on cold hard numbers. In many ways, it can be argued that suffering is not quantifiable, after all how do you measure the pain associated with starvation, sickness, disease, homelessness, war, lawlessness and all the evils of society? But in economic terms economist Arthur Okun developed a simple but brilliant method of determining how miserable people were economically. The Misery Index and Unemployment The first component is unemployment. Okun reasoned that if a lot of people were unemployed, that would make the country as a whole feel poorer and so they would be less well off. Also a side … [Read more...]
U.K. Historical Price Converter Added

This month as a service for our friends in the U.K. we have added a U.K. Historical Price Converter. This handy little calculator will tell you the equivalent value of any prices from 1751 to the present. It is based on the "Retail Prices Index" which was instituted in Great Britain in 1947 in an effort to determine how much the war was affecting prices. The data was later "backdated" to include prices back to 1751 by Jim O’Donoghue, Louise Goulding, and Grahame Allen in a paper entitled ‘Consumer Price Inflation Since 1750’. In it they state that, their article presents: "a composite price index covering the period since 1750 which can be used for analysis of consumer price … [Read more...]
Inflation was Up Slightly in January 2014
Current Inflation Commentary- The U.S. Bureau of Labor Statistics has released the Annual Inflation rate today. For the year ending in January, inflation was 1.58% up very slightly from 1.50% for the year ending in December 2013. Annual inflation is made up of 12 monthly inflation components and although monthly inflation was virtually Zero for December 2013 and rose to 0.37% in January. This fits well with the historical trend of low inflation in the 4th quarter and high inflation in the first quarter of the year. The Consumer Price Index came in at 233.916 in January which was actually … [Read more...]
Current Inflation Commentary for December 2013
Current Annual Inflation Commentary Annual Inflation: Annual inflation rose was 1.24% in November and rose to 1.50% in December. Monthly inflation for December 2013 was -0.01 or virtually Zero. Going by the Consumer Price Index which was 233.049 in December, 233.546 in October and 234.149 in September prices were "rolled back" to below June levels when they were 233.504 but greater than May when they were 232.945. Annual Inflation was 1.50% in spite of the FED buying $85 Billion a month in Bonds lending more credence to Robert Prechter's Deflationary scenario. You can get Robert Prechter's 90 page deflation survival guide free here. Historically monthly inflation rates tend to be … [Read more...]
What Causes Unemployment?

I recently received the following question about unemployment from a gentleman in Tanzania and I thought it was a good question and I would share the answer with you. What Causes Unemployment? I have been thinking on that situation of unemployment. Why does the rate of unemployment increase day after day? Does it mean that people have decreased the rate of thinking on creating jobs or there is any other reason? ~ Lioba from Dar-es-Salaam Tanzania. Here is my Response: Lioba, That is a very good question. Unemployment is a function of how efficient the marketplace is. In a purely agricultural economy, there is no unemployment, everyone has to work, if they don't work they don't eat. … [Read more...]
