• Home
  • Related Sites
    • Financial Trend Forecaster
      • Moore Inflation Predictor
      • NYSE Rate of Change (ROC)
      • NASDAQ Rate of Change (ROC)
      • Crypto ROC- BTC & ETH
    • Unemployment Data
      • Historical Employment Data
      • Unemployment Rate Chart
      • Labor Force Participation Rate
    • Optio Money
    • Elliott Wave University
    • More Resources
  • Definitions
    • What is Inflation?
    • What is Core Inflation?
    • Inflation vs CPI
    • What is Deflation?
    • What is Disinflation?
    • What is Agflation?
    • What is Stagflation?
    • What is Hyperinflation?
    • What is Quantitative Easing?
    • What is Quantitative Tightening?
    • What is Velocity of Money?
    • What is Fiat Currency?
    • How Do I Calculate Inflation?
    • What are “Sticky Prices” and Why Do They Matter?
  • Featured Content
  • About Us
  • Feedback
    • Sitemap
  • Subscribe Now

InflationData.com

Your Place in Cyber Space for Inflation Data

CPI Index

CPIWidgetSept25
  • Numerical Inflation Data
    • Current Inflation Rate
    • Monthly Inflation Rate
    • Historical U.S. Inflation Rates
    • Historical CPI
  • Inflation Charts
    • Ann. Inf. Rate Chart
    • Long Term Inflation >
      • Ave. Inf. by Decade
      • Total Inf. by Decade
      • Inflation 1913-1919
      • Inflation 1920-1929
      • Inflation 1930-1939
      • Inflation 1940-1949
      • Inflation 1950-1959
      • Inflation 1960-1969
      • Inflation 1970-1979
    • Cumulative Inflation
    • FED Monetary Policy and Inflation
    • Inflation and Recession
    • Confederate Inflation (1861 – 1865)
    • Misery Index
    • The 3 Stages of Inflation
    • 15-Yr Inflation Trends Chart
  • Inflation Calculators
    • Cumulative Inf. Calc.
    • How Much Would it Cost
    • Salary Inf. Calc.
    • Cost of Living Calc.
    • U.K. Inf. Calc.
    • Cost of Gas Calc.
    • Net Worth Calc.
    • Lifetime Earnings Calc.
    • Savings Goal Calc.
    • Financial Calculators
  • Inf. Adjusted Prices
    • Energy >
      • Inflation Adj. Gas Prices
      • Historical Oil Prices Chart
      • Crude Oil Price (Table)
      • Natural Gas Prices
      • Electricity Prices
      • Oil vs Gold
    • Gold >
      • Inflation Adjusted Annual Average Gold Prices
      • Gold is a “Crisis Hedge” not an  “Inflation Hedge”
      • Comparing Oil vs. Gold
    • Corn Prices
    • Education Inflation
    • Housing Prices
    • Mortgage Rates
    • NYSE Index
    • Inf. Indexed Bonds
    • Movie Revenues
    • Inflation-Adjusted Wages
  • Cost of Living
    • Calculate Cost of Living
    • Cost-of-living Adj. (COLA)
    • Consumer Price Index CPI
      • Historical CPI
      • Current CPI
      • CPI Release Dates
    • Gas Prices >
      • Cost of Gas
      • Cost of Gas Per Month
      • Gas vs. Oil Price Chart
    • Food Prices 1913 vs 2013
    • Health Insurance
  • Blog
    • Key Inflation Articles
    • International Inflation
    • Historical Inflation Rates for Japan (1971 to 2014)
You are here: Home » Blog » Economy » What is the Misery Index?

What is the Misery Index?

Published on March 16, 2014 Updated on March 16, 2016 by Tim McMahon Leave a Comment

The misery index was created by economists in an effort to quantify how bad the economy is based on cold hard numbers. In many ways, it can be argued that suffering is not quantifiable, after all how do you measure the pain associated with starvation, sickness, disease, homelessness, war, lawlessness and all the evils of society?  But in economic terms economist Arthur Okun developed a simple but brilliant method of determining how miserable people were economically.

The Misery Index and Unemployment

What is the Misery IndexThe first component is unemployment. Okun reasoned that if a lot of people were unemployed, that would make the country as a whole feel poorer and so they would be less well off. Also a side effect of just knowing that the unemployment rate is increasing is an increase in fear that people might lose their own job as well and this will cause them to cut back on their spending of discretionary items and to save more “just in case”. As a result, more businesses will be hurting from the lack of spending and the suffering will compound.

The Misery Index and Inflation

The second component is inflation. Inflation in this case is defined as an increase in prices. The primary cause is an increase in the money supply “Printing Money” at a greater pace than the growth of the “GDP” i.e. Gross Domestic Product. If prices increase  more rapidly than salaries individuals will have to reduce their consumption resulting in a lower standard of living.

Calculating the Misery Index

Since both the inflation rate and the unemployment rate are percentages and they each get “worse” as they increase it is a simple matter to simply add the two numbers. Thus if the inflation rate is 3% and the unemployment rate is 6% the misery index would be 9%.  Traditionally the it is calculated using the official data from the U.S. Bureau of Labor Statistics and the two exact components are the “Seasonally Adjusted” numbers. So to calculate the official Misery index you would add the Seasonally adjusted CPI-U based inflation rate and add it to the BLS’s  Seasonally Adjusted U-3 Unemployment rate.

Misery Index Definition

The definition of the misery index is “A measure of economic well-being for a specified economy, computed by taking the sum of the unemployment rate and the inflation.”
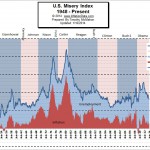
Misery Index Chart

This index is often presented as a chart. At InflationData we include data not only about the inflation rate, unemployment rate and combined misery index but also the political party of of the President at the time.

Some people prefer to see the actual data and so we also present the historical  Misery Index data in table form. Every month we update our current commentary and tell you what it all means. See Current Commentary for a full discussion.

See Also:

  • Which Party Has a Better Misery Index Record?
  • The Misery Index and the Stock Market
  • Producer Price Index (PPI) and Consumer Sentiment Index Point to Deflation
  • Inflation Adjusted Stock Prices
  • Its Weight in Gold: The Real Prices of Things
  • Cost of Living

About Tim McMahon

Connect with Tim on Google+.

  • Web
  • |
  • Twitter
  • |
  • Facebook
  • |
  • LinkedIn
  • |
  • More Posts(404)

Filed Under: Economy, Inflation Tagged With: Misery Index

Leave a Reply Cancel reply

Your email address will not be published. Required fields are marked *

This site uses Akismet to reduce spam. Learn how your comment data is processed.

Latest Posts

  • How Deflation Created the Middle Class
  • October Inflation Numbers Delayed
  • Why the 2.8% COLA May Fall Short of Real Inflation
  • Delayed BLS September Inflation Data Released
  • September CPI Data Delay Causes Social Security COLA Concerns
  • August 2025 Inflation Report
  • Is the FED Getting Soft on Inflation?
  • July Inflation Report

Sponsored:

As a Seasoned Investor I thought I'd seen everything... But recently I discovered TradingView which has really improved the information I have at my fingertips.~ Tim McMahon, editor

TradingView gives me an edge... including powerful charting tools, real-time market data, and a global community of traders—all in one easy to use platform. It has hundreds of indicators, and even custom scripts for more advanced users, and you don't need to change Brokers just use its seamless brokerage integration... TradingView isn't just a charting tool—it's your full trading command center.

Trade smarter. Trade faster. Check Out TradingView for free.

----------

The Best Place to Buy Your Crypto

Coinbase is the largest Crypto Trading platform in the U.S. and the easiest to use. ~Tim McMahon, editor

Check out Coinbase here

Subscribe Now

eTrends Signup Form

Elliott Wave Resources

Free Elliott Wave Resources

What is Waveopedia?

Waveopedia is EWI’s free, comprehensive index of Elliott wave patterns and terms. Everyone from beginners to experts can benefit from it. It’s a great place to send your followers if they’re new to Elliott waves.

  • Deflation Hits China is the U.S. Next?

  • Why You Must Avoid the Herding Trap

  • Chasing Trends Can Cost You

  • More Education Resources

Post Archives

Home | Articles | Sitemap | Terms of Service | Privacy | Disclaimer | Advertise With Us

Copyright © 1996-2025 · Capital Professional Services, LLC · Maintained by Design Synergy Studio · Admin

Do Not Sell My Personal Information