• Home
  • Related Sites
    • Financial Trend Forecaster
      • Moore Inflation Predictor
      • NYSE Rate of Change (ROC)
      • NASDAQ Rate of Change (ROC)
      • Crypto ROC- BTC & ETH
    • Unemployment Data
      • Historical Employment Data
      • Unemployment Rate Chart
      • Labor Force Participation Rate
    • Optio Money
    • Elliott Wave University
    • More Resources
  • Definitions
    • What is Inflation?
    • What is Core Inflation?
    • Inflation vs CPI
    • What is Deflation?
    • What is Disinflation?
    • What is Agflation?
    • What is Stagflation?
    • What is Hyperinflation?
    • What is Quantitative Easing?
    • What is Quantitative Tightening?
    • What is Velocity of Money?
    • What is Fiat Currency?
    • How Do I Calculate Inflation?
    • What are “Sticky Prices” and Why Do They Matter?
  • Featured Content
  • About Us
  • Feedback
    • Sitemap
  • Subscribe Now

InflationData.com

Your Place in Cyber Space for Inflation Data

CPIWidget-Feb26
  • Numerical Inflation Data
    • Current Inflation Rate
    • Monthly Inflation Rate (Moved)
    • Historical U.S. Inflation Rates
    • Historical CPI
  • Inflation Charts
    • Ann. Inf. Rate Chart
    • Long Term Inflation >
      • Ave. Inf. by Decade
      • Total Inf. by Decade
      • Inflation 1913-1919
      • Inflation 1920-1929
      • Inflation 1930-1939
      • Inflation 1940-1949
      • Inflation 1950-1959
      • Inflation 1960-1969
      • Inflation 1970-1979
    • Cumulative Inflation
    • FED Monetary Policy and Inflation
    • Inflation and Recession
    • Confederate Inflation (1861 – 1865)
    • Misery Index
    • The 3 Stages of Inflation
    • 15-Yr Inflation Trends Chart
  • Inflation Calculators
    • Cumulative Inf. Calc.
    • How Much Would it Cost
    • Historical Inflation Calculator since 1774
    • Salary Inf. Calc.
    • U.K. Inf. Calc.
    • Cost of Gas Calc.
    • Net Worth Calc.
    • Lifetime Earnings Calc.
    • Savings Goal Calc.
    • Financial Calculators
  • Inf. Adjusted Prices
    • Energy >
      • Inflation Adj. Gas Prices
      • Historical Oil Prices Chart
      • Crude Oil Price (Table)
      • Natural Gas Prices
      • Electricity Prices
      • Oil vs Gold
    • Gold >
      • Inflation Adjusted Annual Average Gold Prices
      • Gold is a “Crisis Hedge” not an  “Inflation Hedge”
      • Comparing Oil vs. Gold
    • Corn Prices
    • Education Inflation
    • Housing Prices
    • Mortgage Rates
    • NYSE Index
    • Inf. Indexed Bonds
    • Movie Revenues
    • Inflation-Adjusted Wages
  • Cost of Living
    • Calculate Cost of Living
    • Cost-of-living Adj. (COLA)
    • Consumer Price Index CPI
      • Historical CPI
      • Current CPI
      • CPI Release Dates
    • Gas Prices >
      • Cost of Gas
      • Cost of Gas Per Month
      • Gas vs. Oil Price Chart
    • Food Prices 1913 vs 2013
    • Health Insurance
  • Blog
    • Key Inflation Articles
    • International Inflation
    • Historical Inflation Rates for Japan (1971 to 2014)
You are here: Home » Blog » Inflation » Annual Inflation Down in February

Annual Inflation Down in February

Published on March 18, 2014 Updated on March 31, 2021 by Tim McMahon Leave a Comment

Current Inflation Commentary-

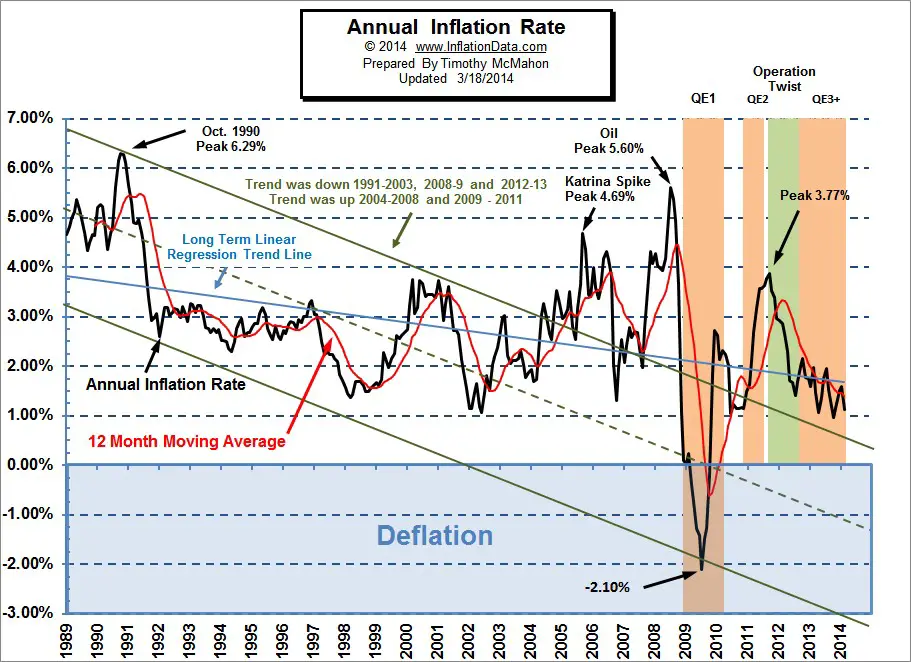
The U.S. Bureau of Labor Statistics has released the Annual Inflation rate today. For the year ending in February, inflation was 1.13% down roughly 1/3rd from 1.58% for the year ending in January.

Monthly inflation was relatively high at 0.37% in January and the same again in February. This is consistent with the historical trend of low inflation in the 4th quarter and high inflation in the first quarter of the year.

Inflation ChartClick for larger image

The Consumer Price Index came in at 234.781 in February which was  very close to what it was back in September of 2013 when it was 234.149. This is the result of three intervening deflationary months of October, November and December which “rolled back” prices to almost August levels when they were 233.877.

See  Current Annual Inflation for full commentary on the current situation.

The Misery Index

US Misery Index Jan 2014
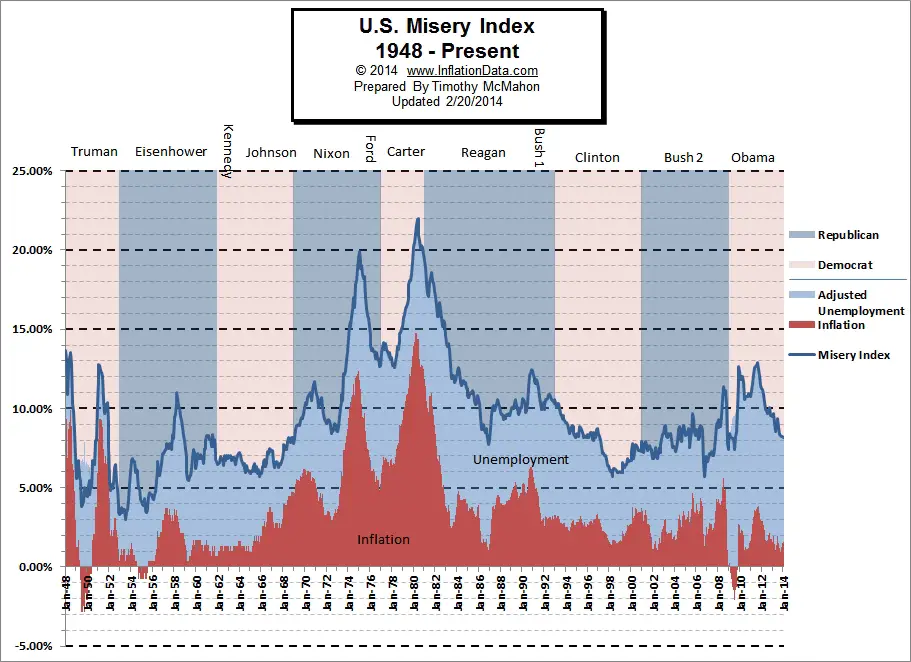
The misery index as of  March 2014 (based on the most recent official government data for February 2014)  is at 7.83% down from a peak of 12.87% in both October and November 2011 which was pretty miserable. With inflation at historically low levels the major component of the Misery index is unemployment. However, if independent non-government numbers are used the misery index is closer to 10%.  See full commentary of the index here.

Monthly inflation:

According to AAA the nationwide retail Cost of Gasoline (Regular) averaged $3.306 in January 2014 virtually identical to $3.29 in January 2013 it was up to $3.83 in February. One of the major increases in cost this month were due to a 4.1% increase in fuel oil over the month. Although electricity declined -0.4% over the month, it still rose 3.8% over the last year. Natural gas was another big gainer increasing 3.4% over the month and 8.3% over a year. This was primarily due to the extraordinary winter though and not a strictly monetary phenomenon.  Airfares were up 2% for the month but still down -3.8% over a year. Hospital services continue to outpace inflation with a 1.5% monthly increase and a 4.7% annual increase. Food prices increased 0.3% for the month and 1.4% on an annual basis.

The Moore Inflation Predictor

The MIP was right on the money last month predicting a sharp drop in inflation. Our target range was a worst case low of 1.10% and a worst case high of 1.18% and a median projection of 1.14% and the announcement today was 1.13% so we couldn’t get much closer. See the Moore Inflation Predictor for more information on what to expect next.

NYSE ROC

The New York Rate of Change chart has generated a sell signal which we are taking seriously.

NASDAQ ROC

NASDAQ is still in buy territory but the most recent  peak is looking very scary. Caution is advised.


For more information on the Current Inflation Rate or the Historical Inflation Rate we have tables and charts for them.

You may also like:

  • Current Annual Inflation
  • Cumulative Inflation Calculator
  • Pushing on a String, Velocity of Money and Money Multiplier Conspire Against the FED
  • Velocity of Money and Money Multiplier- Why Deflation is Possible

About Tim McMahon

Connect with Tim on Google+.

  • Web
  • |
  • Twitter
  • |
  • Facebook
  • |
  • LinkedIn
  • |
  • More Posts(410)

Filed Under: Inflation

Leave a Reply Cancel reply

Your email address will not be published. Required fields are marked *

This site uses Akismet to reduce spam. Learn how your comment data is processed.

Latest Posts

  • Inflation Down In January 2026
  • BLS Inflation Data Delayed
  • Updated Cumulative Inflation Calculator
  • Inflation-Adjusted Silver Prices
  • December Inflation Down Slightly, Not Flat
  • December 2025 Inflation Report for November
  • How Deflation Created the Middle Class
  • October Inflation Numbers Delayed

Sponsored:

As a Seasoned Investor I thought I'd seen everything... But recently I discovered TradingView which has really improved the information I have at my fingertips.~ Tim McMahon, editor

TradingView gives me an edge... including powerful charting tools, real-time market data, and a global community of traders—all in one easy to use platform. It has hundreds of indicators, and even custom scripts for more advanced users, and you don't need to change Brokers just use its seamless brokerage integration... TradingView isn't just a charting tool—it's your full trading command center.

Trade smarter. Trade faster. Check Out TradingView for free.

----------

The Best Place to Buy Your Crypto

Coinbase is the largest Crypto Trading platform in the U.S. and the easiest to use. ~Tim McMahon, editor

Check out Coinbase here

Subscribe Now

eTrends Signup Form

Elliott Wave Resources

Free Elliott Wave Resources

What is Waveopedia?

Waveopedia is EWI’s free, comprehensive index of Elliott wave patterns and terms. Everyone from beginners to experts can benefit from it. It’s a great place to send your followers if they’re new to Elliott waves.

  • Deflation Hits China is the U.S. Next?

  • Why You Must Avoid the Herding Trap

  • Chasing Trends Can Cost You

  • More Education Resources

Post Archives

Home | Articles | Sitemap | Terms of Service | Privacy | Disclaimer | Advertise With Us

Copyright © 1996-2026 · Capital Professional Services, LLC · Maintained by Design Synergy Studio · Admin

Do Not Sell My Personal Information