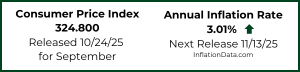
The U.S. Bureau of Labor Statistics released its delayed September 2025 Inflation report on October 24th, 2025. The report showed that annual inflation rose from 2.9% in August to 3.0% in September.
Calculated to two digits, it was 2.92% in August and 3.01% in September.
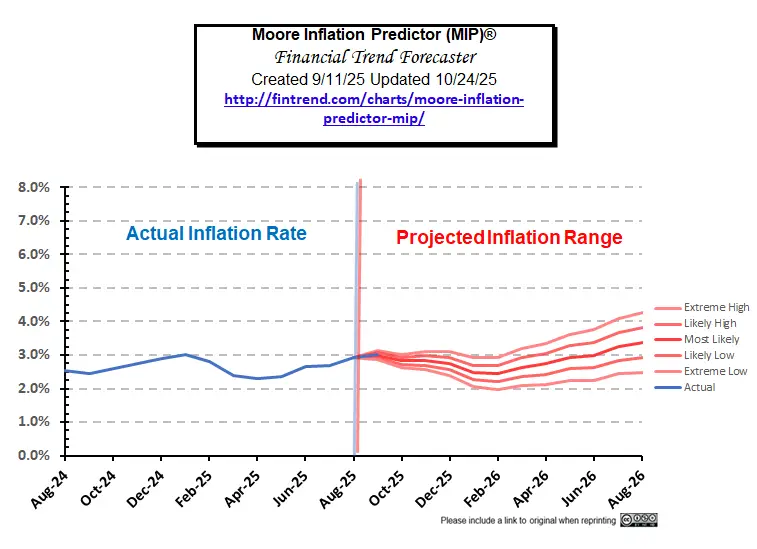
September’s Inflation Prediction:
At 3.01%, September’s inflation numbers came in very close to our “most likely” projection and almost identical to January 2025.
September 2025 Inflation Summary:
- Annual Inflation rose from 2.92% to 3.01%
- CPI Index rose from 323.926 to 324.800
- Monthly Inflation for September was 0.25%
- Next release November 13th, 2025
Note: We will only be publishing an abbreviated eTrends newsletter this month due to the government shutdown and limited data availability.
Annual Inflation Table

BLS Commentary:
CONSUMER PRICE INDEX – SEPTEMBER 2025
The Consumer Price Index for All Urban Consumers (CPI-U) increased 0.3 percent on a seasonally adjusted basis in September, after rising 0.4 percent in August, the U.S. Bureau of Labor Statistics reported today. Over the last 12 months, the all items index increased 3.0 percent before seasonal adjustment. Note that September CPI data collection was completed before the lapse in appropriations. The index for gasoline rose 4.1 percent in September and was the largest factor in the all items monthly increase, as the index for energy rose 1.5 percent over the month. The food index increased 0.2 percent over the month as the food at home index rose 0.3 percent and the food away from home index increased 0.1 percent. The index for all items less food and energy rose 0.2 percent in September, after rising 0.3 percent in each of the 2 preceding months. Indexes that increased over the month include shelter, airline fares, recreation, household furnishings and operations, and apparel. The indexes for motor vehicle insurance, used cars and trucks, and communication were among the few major indexes that decreased in September. The all items index rose 3.0 percent for the 12 months ending September, after rising 2.9 percent over the 12 months ending August. The all items less food and energy index also rose 3.0 percent over the last 12 months. The energy index increased 2.8 percent for the 12 months ending September. The food index increased 3.1 percent over the last year.
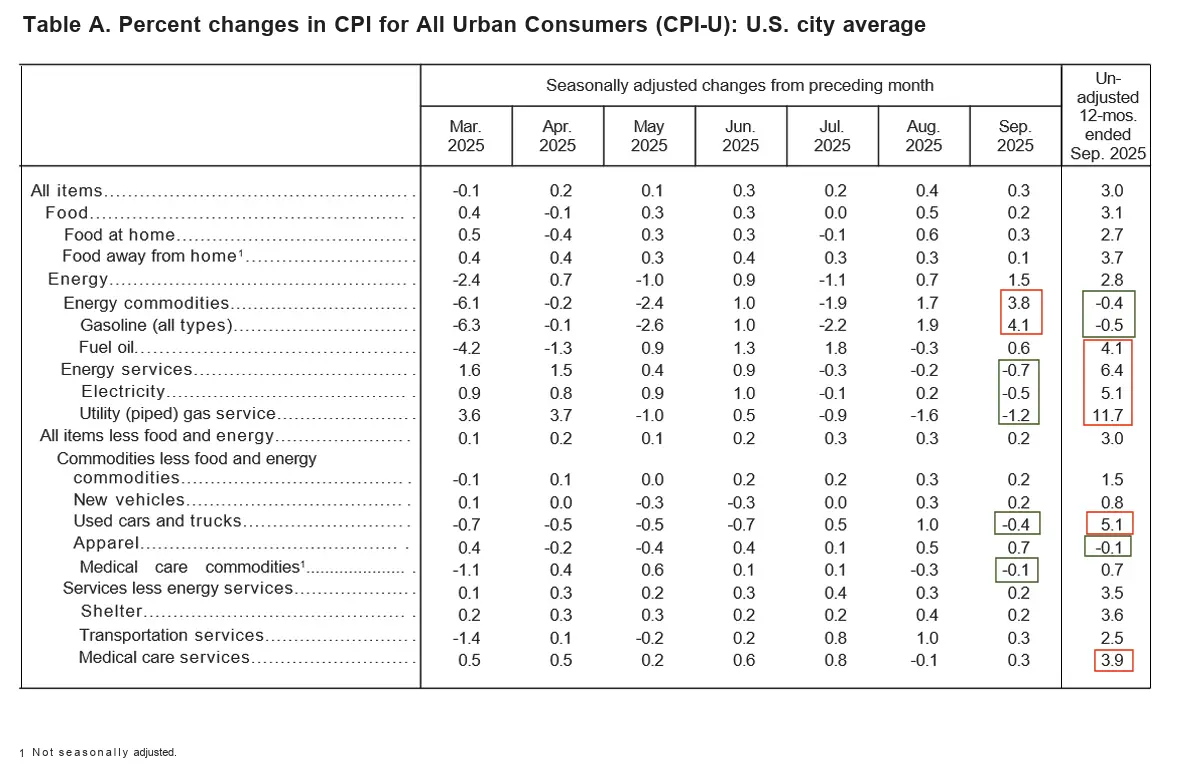
Individual Components:
Looking at Table A below, we can see that on an annual basis, energy commodities and gasoline are down for the year but up sharply for the month. But Energy Services are up sharply for the year but down for the month.
The biggest gainers on an annual basis were Utility piped gas, Used Vehicles, and Medical Services.
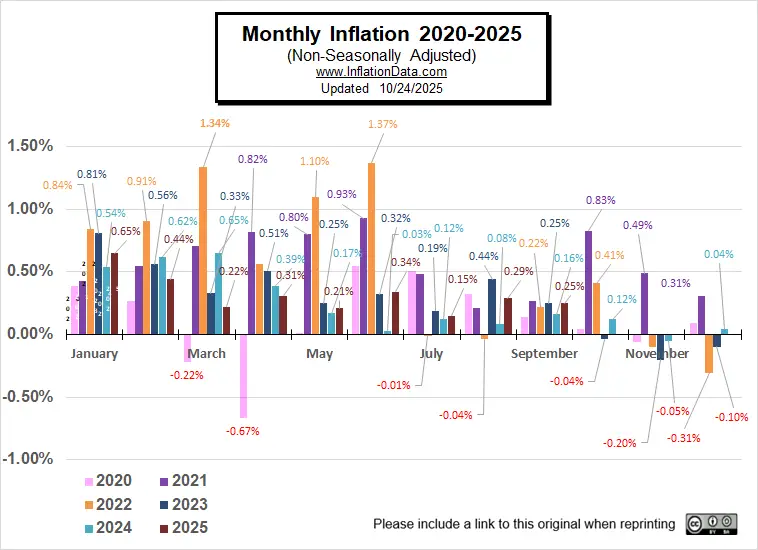
Inflation Chart
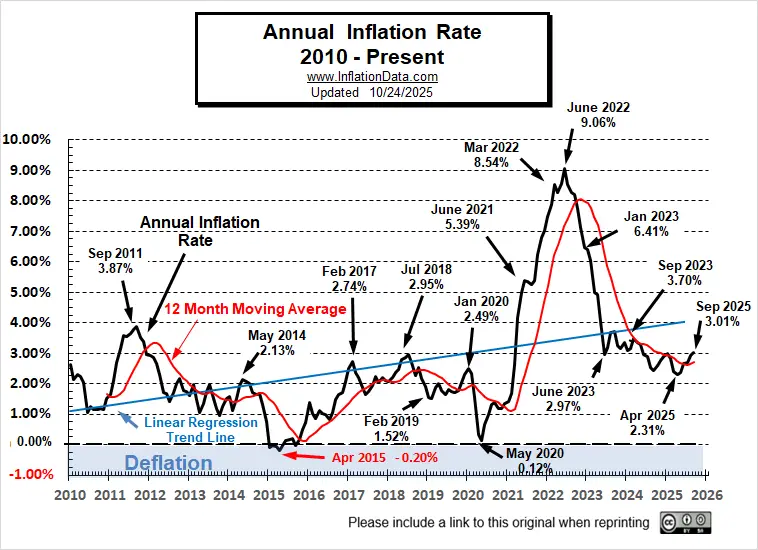
Monthly Inflation Compared to Previous Years:
The monthly inflation rate for September 2025 was 0.25%.
Rate of Change (ROC) Charts
Despite the recent rebound the NYSE ROC hasn’t recovered from the November Sell Signal.
NYSE Rate of Change

The NASDAQ ROC may have generated a Buy signal.

Crypto Rate of Change
Bitcoin generated a Sell signal in February.

ETH still has an intact BUY signal.

Here are some articles you might enjoy in case you missed them:
Read more on UnemploymentData.com.
From InflationData.com
- September CPI Data Delay Causes Social Security COLA Concerns
- August 2025 Inflation Report
- Is the FED Getting Soft on Inflation?
From Financial Trend Forecaster
- Moore Inflation Predictor
- NYSE ROC
- NASDAQ ROC
- ETH and BTC Buy Signal
- Government Shutdown 2025: What It Means for You and the Markets
- Fed’s First Rate Cut in Nine Months
- Pirates of the Crypto-ribbean
- Overcoming Power Grid Demand Problems- Then and Now
From Elliott Wave University
- This Forecasting Tool Nailed the S&P Turns
- Warren Buffett isn’t buying — and that says a lot.
- Debt Ceiling Drama
- Stock Market Signal: Only 3 Times in 47 Years!
- Tesla’s Troubles — Is it Musk or is it More?
From OptioMoney
Leave a Reply