
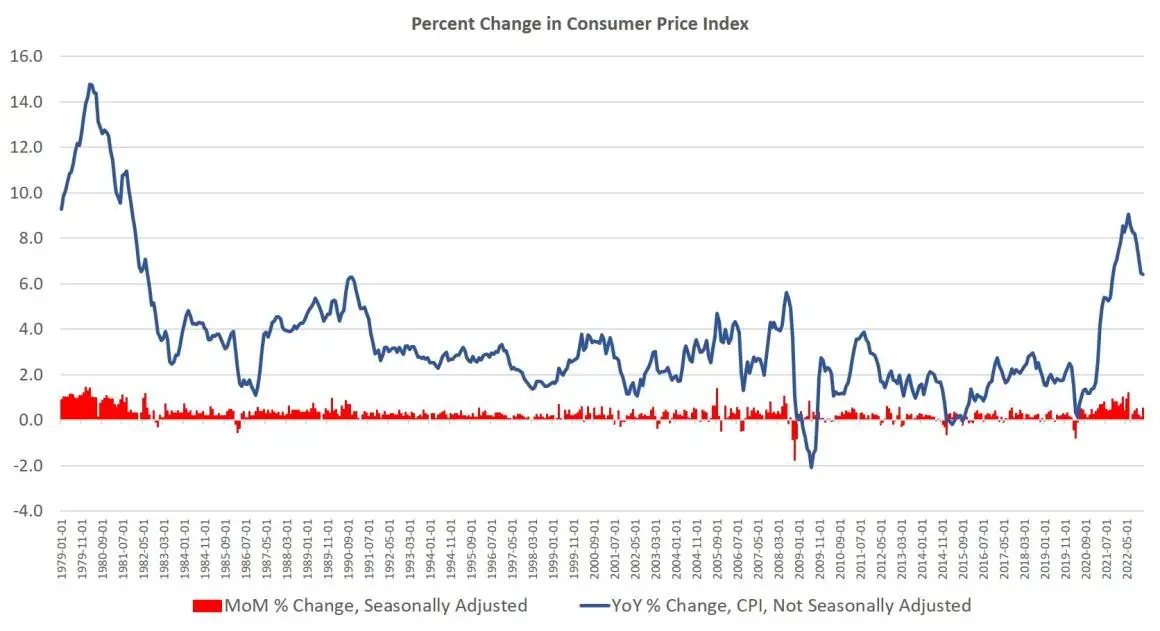
The federal government’s Bureau of Labor Statistics (BLS) released new price inflation data today, [i.e., February 14th], and according to the report, price inflation during the month decelerated slightly, coming in at the lowest year-over-year increase in sixteen months. According to the BLS, Consumer Price Index (CPI) inflation rose 6.4 percent year over year in January before seasonal adjustment. That’s down very slightly from December’s year-over-year increase of 6.5 percent, and January is the twenty-third month in a row with inflation above the Fed’s arbitrary 2 percent inflation target. Price inflation has now been above 6.0 percent for sixteen months in a row.
[Editor’s note: Calculated to two decimal places, the actual decrease was even less, i.e., from 6.45% in December to 6.41% in January.]
Meanwhile, month-over-month inflation rose to a three-month high, with the CPI rising 0.5 percent (seasonally adjusted) from December to January.
January’s year-over-year growth rate is down from June’s high of 9.1 percent, which was the highest price inflation rate since 1981. But January’s growth rate still keeps price inflation above growth rates seen in any month during the 1990s, 2000s, or 2010s. January’s increase was the fourteenth-largest increase in forty years.
The ongoing price increases largely reflect price growth in food, energy, transportation, and especially shelter. In other words, the prices of essentials all saw big increases in January over the previous year.
For example, in January “food at home”—i.e., grocery bills—was up 11.3 percent compared to January of the previous year. Energy overall was up 8.7 percent, while new vehicles were up 5.8 percent. Services saw some of the largest increases, with energy services up 15.6 percent and transportation services up 14.6 percent. The only category that showed a drop over the period was used cars and trucks, which was down 11.6 percent. This hardly returned car prices to 2019 levels, however. Used car price growth reached seventy-year highs throughout much of 2021, increasing year over year by over 20 percent or more in every month from April 2021 to April 2022.
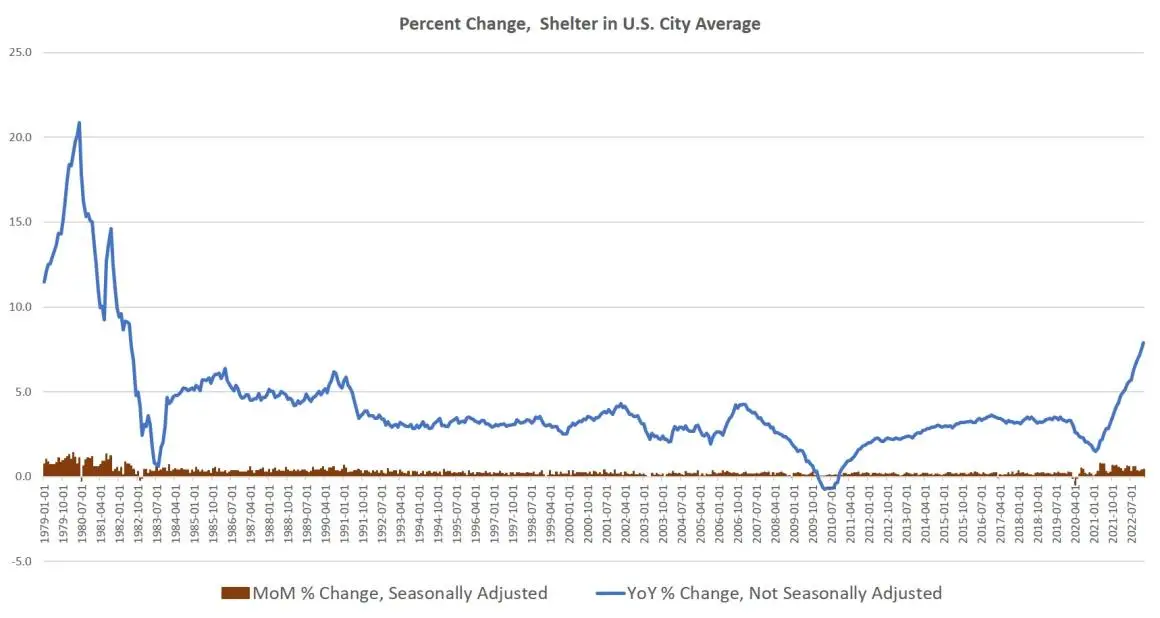
As of January, there was no sign of price growth in shelter slowing down. Last month, shelter prices increased by 7.9 percent year over year, which was the highest growth rate since July 1982. Month-over-month growth in shelter costs also remained among the highest we’ve seen since 1983.
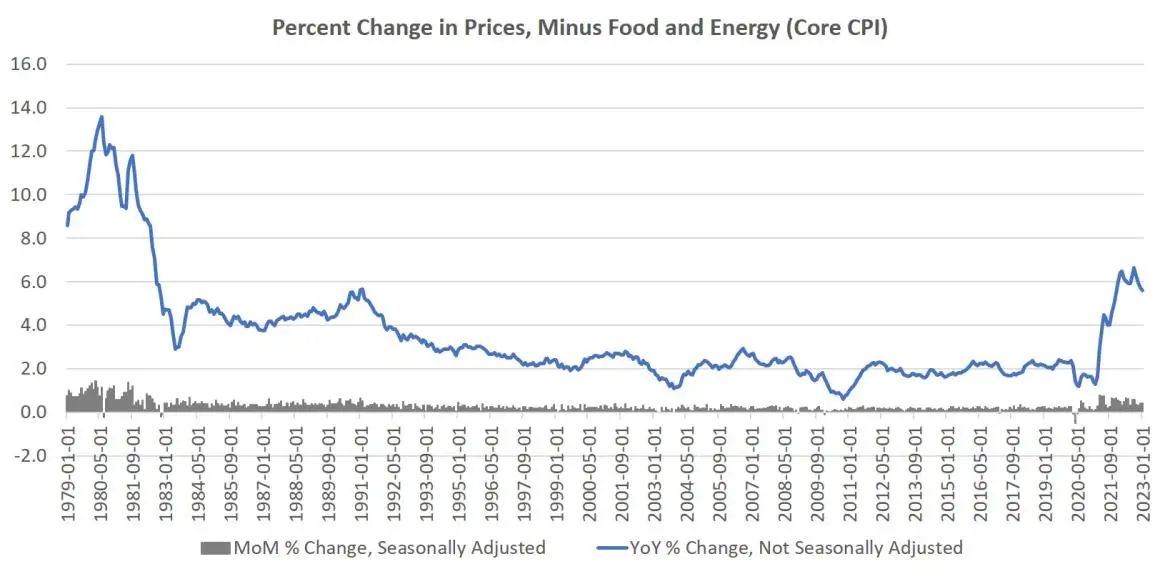
Meanwhile, so-called core inflation—CPI growth minus food and energy—has slowed slightly from the forty-year high reached in September. In January, year-over-year growth in core inflation was 5.6 percent. That’s down slightly from December’s growth rate of 5.7 percent. September’s year-over-year increase of 6.6 percent was the largest recorded since August 1982. January’s month-over-month growth in this measure was positive as well, with prices minus food and energy growing 0.4 percent (seasonally adjusted). That’s equal to December’s month-over-month change of 0.4 percent, and up from October’s and November’s growth rates of 0.3 percent. Month-to-month growth has been positive in every month since May 2020.
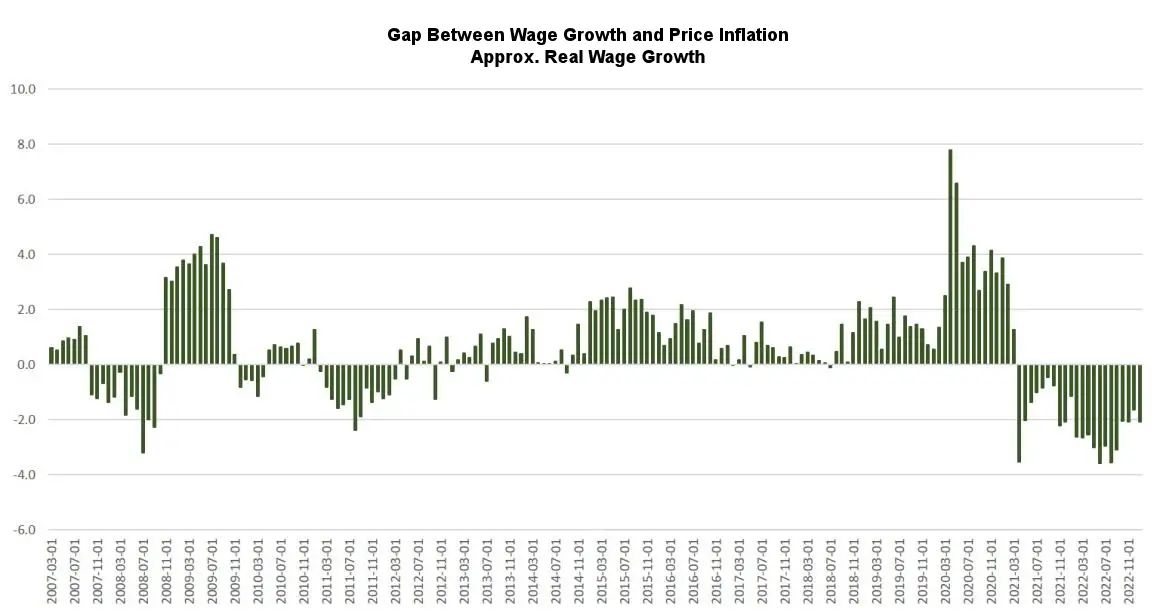
Meanwhile, November was yet another month of declining real wages, and was the twenty-second month in a row during which growth in average hourly earnings failed to keep up with CPI inflation. According to new BLS employment data released last week, hourly earnings increased 4.35 percent year over year in January, meaning wage growth fell behind inflation.
Inflation Is Not “Falling”
The Biden administration today—which has long been rather free and easy with how it slices and dices inflation numbers—said inflation is “coming down.” Joe Biden framed it like this:
Today’s data confirm that annual inflation has fallen for seven straight months. Inflation for food at the grocery store came down again last month. Gas prices are down about $1.60 from their peak last year. And real wages for working Americans are up over the last seven months, delivering welcome breathing room for American families.
This is a rather tortured description of the situation. With the CPI rising both month over month and year over year, it’s a bit of a stretch to say price inflation “came down” in January. It would be more accurate to say that the rate of increase slowed very slightly.
This hasn’t stopped President Biden from declaring that the economy has already achieved a “soft landing” as Politico suggested yesterday.
The markets apparently disagreed, as both the S&P 500 and the Dow Jones ended the day down. Markets likely fear that—in spite of Biden’s narrative—price inflation looks stubborn, suggesting the Fed will continue to move interest rates up. Wall Street, heavily dependent on easy money, wants to see inflation fall so that the Fed will begin loosening again. If price inflation is seen to be slowing, this could be interpreted as an excuse for the Fed to force interest rates back down and resume asset purchases. If a soft landing were already in the cards, Wall Street would be planning for an acceleration of monetary loosening.
The Fed has signaled that it is ready to end its current cycle of rate hikes if it can come up with a political excuse to do so. But with year-over-year CPI inflation still above 6 percent, the Fed is clearly a long way from its arbitrary 2 percent target rate. With this latest CPI report, markets are probably now expecting another 25 basis point rate hike in March.
Nonetheless, until we start to see obvious job losses that cannot be hidden or denied, we should expect to hear plenty from the White House about how “strong” the economy is. Yesterday, Cecilia Rouse of the US Council of Economic Advisers claimed that “these are extraordinary times for America’s economy,” suggesting that the job growth occurring during Biden’s tenure is unparalleled in recent decades. The truth, of course, is that this “job growth” is nothing more than a recovery of jobs that were destroyed by the lockdowns and the covid panic long supported by Biden. In other words, Biden supported breaking the economy’s legs and now wants credit for the fact that those legs have somewhat healed.
In spite of ongoing negative real wage growth, crippling price inflation in rents and home prices, and a notable decline in full-time work, we’ll keep hearing about the strength of the economy. Millions of Americans aren’t exactly feeling prosperous, however. As ABC reported this month, four in ten Americans polled say they are worse off financially since Biden took office. Of course, Biden is hardly the only one to blame. Donald Trump repeatedly called for massive amounts of monetary inflation, complaining on numerous occasions that the Federal Reserve was not inflating the money supply enough. Later, Trump’s record-breaking peacetime government deficits drove even more inflation. We are now living with the consequences of the Trump profligacy. Biden, however, will do nothing to reverse these policies and is thus making inflation and declining real wages part of his own legacy.
![]() This article originally appeared here and was reprinted under the Creative Commons license.
This article originally appeared here and was reprinted under the Creative Commons license.
About the Author:
 Ryan McMaken is a senior editor at the Mises Institute. Ryan has a bachelor’s degree in economics and a master’s degree in public policy and international relations from the University of Colorado. He was a housing economist for the State of Colorado. Ryan is a cohost of the Radio Rothbard podcast, has appeared on Fox News and Fox Business, and has been featured in a number of national print publications including Politico, The Hill, Bloomberg, and The Washington Post.

Leave a Reply