
In 2011, the Federal Reserve invented new accounting methods for itself so that it could never legally go bankrupt. As explained by Robert Murphy, the Federal Reserve redefined its losses so as to ensure its balance sheet never shows insolvency. As Bank of America’s Priya Misra put it at the time:
As a result, any future losses the Fed may incur will now show up as a negative liability (negative interest due to Treasury) as opposed to a reduction in Fed capital, thereby making a negative capital situation technically impossible.
That was twelve years ago, and it was all academic at the time. But in 2023, the Fed really is insolvent, although its fake post-2011 account doesn’t show this. Nevertheless, the reality is that the Fed’s assets are losing value at the same time that the Fed is paying out more in interest than it is making in interest income.
This became clear last week, when the Fed released a new report showing that its interest payments on bank reserves skyrocketed in 2022. The press release states:
Total interest expense of $102.4 billion increased $96.6 billion from 2021 total interest expense of $5.7 billion; of the increase in interest expense, $55.1 billion pertained to interest expense on Reserve Balances held by depository institutions and $41.5 billion related to interest on securities sold under agreements to repurchase.
As this graphic from the Fed shows, the cost of operations also exceeded earnings in 2022 because remittances have fallen from 2021:
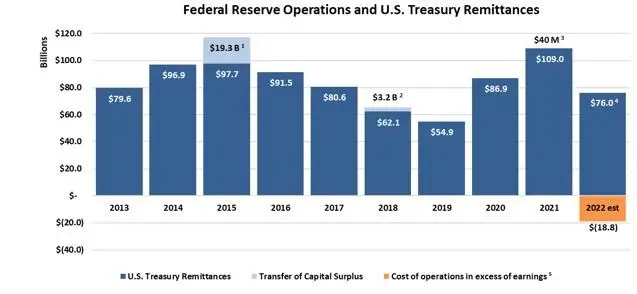
For the year overall, the Fed still managed to achieve a positive net income, thanks to positive inflows in the first half of the year. But since September, as Reuters notes, the Fed began recording what’s called a deferred asset, which tallies up the Fed’s loss; the deferred asset stood at $18.8 billion at the end of the year.
The “deferred asset” phrase basically means “losing money” in Fedspeak: the Fed is supposed to make remittances to the US Treasury out of its surplus, but when it has no surplus, the Fed “defers” its payments. We can see how these remittances plummeted into negative territory beginning in September:
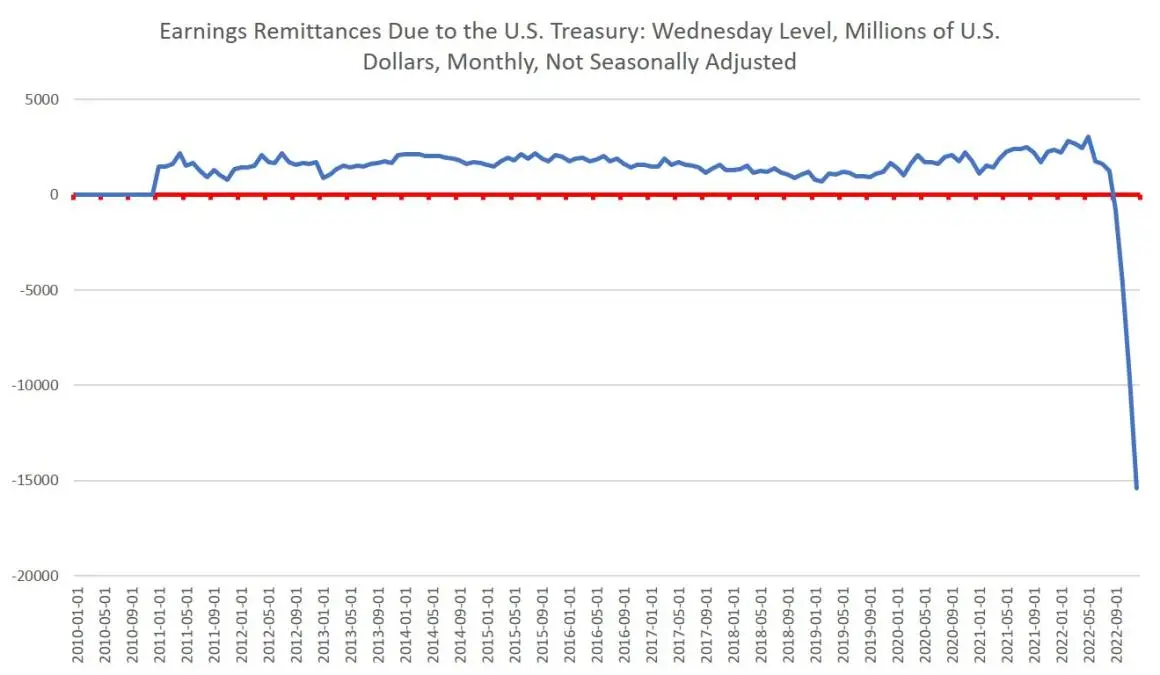
The trend of falling remittances is unlikely to reverse in 2023, unless the Fed takes a very dovish turn and forces interest rates down again. What is more likely is that the Fed will hold rates flat or only slightly reduce them. In either case, the Fed will have to keep paying out more in interest than it makes in income.
Why Is the Fed Insolvent Now?
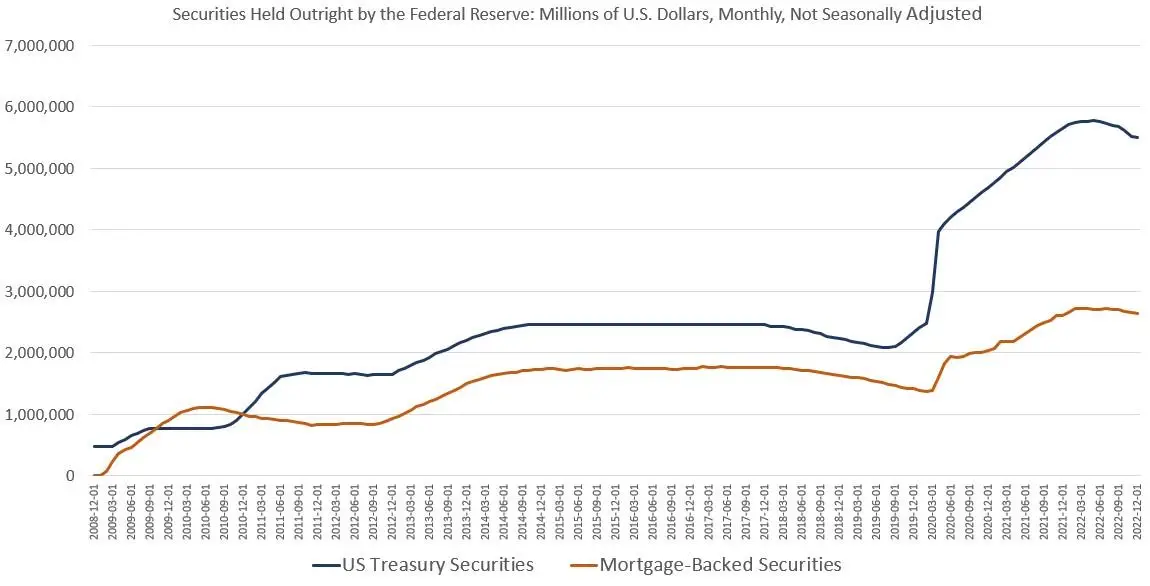
A sizable part of the reason that the Fed has become insolvent in recent months (and almost certainly will be in 2023 overall) stems from the fact that since 2008, the Fed has bought up trillions of dollars in Treasury debt and mortgage-backed securities (MBSs). The Fed has done this to prop up the prices of real estate and government bonds (i.e., to subsidize Wall Street, banks, and the real estate industry.)
Yet it bought these fixed-rate assets when interest rates were very low, and most of those assets have a maturity of over a year. That means that even as interest rates have risen in the past year, the Fed’s income from these assets has not risen sizably. Yet the Fed is also paying banks interest on reserves and reverse repos. That interest rate is not fixed and changes rapidly. So, although total reserves at the Fed have fallen by 25 percent in recent months, that won’t bring interest payments down to 2021 levels because interest rates have increased 4,300 percent, from 0.1 percent to 4.4 percent.
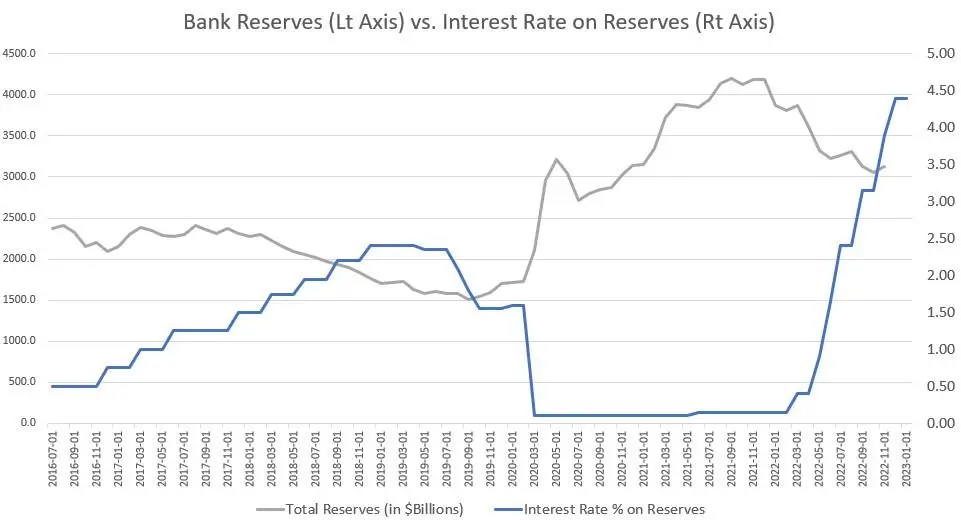
The end result? The Fed is now paying out more interest to banks than it earns in income from the MBSs and government bonds that it holds in its portfolio. Thus, as we saw in the Fed’s Friday release, outflows in interest payments have surged but income has not, and the Fed is now forced to defer its promised payments to the Treasury.
Another complicating factor driving the Fed deeper into the red is the fact that its portfolio is also losing value.
(The key to understanding how this becomes a problem is to remember that bond prices move in the opposite direction of interest rates. So, as newly issued bonds’ interest rates [i.e., yields] move up, the prices of existing bonds move down.)
As interest rates have moved up in the past year, the value of the Fed’s MBSs and Treasury debt has fallen. So now the Fed also has less capital. Thanks to Enron-like accounting, however, the Fed’s bankruptcy is legally just a matter of “deferred assets,” so it’s not a legal problem for the Fed.
Nonetheless, that the Fed’s losses are likely to mount further and require a bailout can be seen in the fact that we’ve seen this sort of problem before. As noted by Alex Pollock in a 2022 lecture at the Mises Institute, the Fed has put itself in a situation similar to the one that sank the savings and loans in the early 1990s. Like the S and Ls, the Fed “invested” in large amounts of long-term debt at low fixed interest rates. But then interest rates went up. The fixed-rate interest income stayed largely the same, but interest payment obligations increased sizably. That’s where the Fed is now.
For a normal financial institution, this situation leads to bankruptcy. But the Fed will bail itself out by printing money. In the end, that means price inflation, either in assets like stocks and real estate or in consumer goods like eggs and auto parts. Ordinary people will see their cost of living go up and their real wages fall, and they’ll get poorer. Through it all, though, the Fed and the regime itself will benefit. As the Fed has been careful to say in recent days, its de facto bankruptcy does not impede its ability to carry out its usual inflationary monetary policy. Never fear—because the Fed can create its own income at will via monetary inflation, the regime will continue to benefit from the Fed’s usual tricks. The regime will be able to run higher deficits, spending on “free” benefits for the voters and on corporate welfare for the politically powerful. It’s all a great scam for the parasitical class. For the productive classes? Not so much.
 This article originally appeared here and was reprinted under the Creative Commons license.
About the Author:
 Ryan McMaken is a senior editor at the Mises Institute. Ryan has a bachelor’s degree in economics and a master’s degree in public policy and international relations from the University of Colorado. He was a housing economist for the State of Colorado. Ryan is a cohost of the Radio Rothbard podcast, has appeared on Fox News and Fox Business, and has been featured in a number of national print publications including Politico, The Hill, Bloomberg, and The Washington Post.

Leave a Reply