• Home
  • Related Sites
    • Financial Trend Forecaster
      • Moore Inflation Predictor
      • NYSE Rate of Change (ROC)
      • NASDAQ Rate of Change (ROC)
      • Crypto ROC- BTC & ETH
    • Unemployment Data
      • Historical Employment Data
      • Unemployment Rate Chart
      • Labor Force Participation Rate
    • Optio Money
    • Elliott Wave University
    • More Resources
  • Definitions
    • What is Inflation?
    • What is Core Inflation?
    • Inflation vs CPI
    • What is Deflation?
    • What is Disinflation?
    • What is Agflation?
    • What is Stagflation?
    • What is Hyperinflation?
    • What is Quantitative Easing?
    • What is Quantitative Tightening?
    • What is Velocity of Money?
    • What is Fiat Currency?
    • How Do I Calculate Inflation?
    • What are “Sticky Prices” and Why Do They Matter?
  • Featured Content
  • About Us
  • Feedback
    • Sitemap
  • Subscribe Now

InflationData.com

Your Place in Cyber Space for Inflation Data

CPIWidget-Feb26
  • Numerical Inflation Data
    • Current Inflation Rate
    • Monthly Inflation Rate (Moved)
    • Historical U.S. Inflation Rates
    • Historical CPI
  • Inflation Charts
    • Ann. Inf. Rate Chart
    • Long Term Inflation >
      • Ave. Inf. by Decade
      • Total Inf. by Decade
      • Inflation 1913-1919
      • Inflation 1920-1929
      • Inflation 1930-1939
      • Inflation 1940-1949
      • Inflation 1950-1959
      • Inflation 1960-1969
      • Inflation 1970-1979
    • Cumulative Inflation
    • FED Monetary Policy and Inflation
    • Inflation and Recession
    • Confederate Inflation (1861 – 1865)
    • Misery Index
    • The 3 Stages of Inflation
    • 15-Yr Inflation Trends Chart
  • Inflation Calculators
    • Cumulative Inf. Calc.
    • How Much Would it Cost
    • Historical Inflation Calculator since 1774
    • Salary Inf. Calc.
    • U.K. Inf. Calc.
    • Cost of Gas Calc.
    • Net Worth Calc.
    • Lifetime Earnings Calc.
    • Savings Goal Calc.
    • Financial Calculators
  • Inf. Adjusted Prices
    • Energy >
      • Inflation Adj. Gas Prices
      • Historical Oil Prices Chart
      • Crude Oil Price (Table)
      • Natural Gas Prices
      • Electricity Prices
      • Oil vs Gold
    • Gold >
      • Inflation Adjusted Annual Average Gold Prices
      • Gold is a “Crisis Hedge” not an  “Inflation Hedge”
      • Comparing Oil vs. Gold
    • Corn Prices
    • Education Inflation
    • Housing Prices
    • Mortgage Rates
    • NYSE Index
    • Inf. Indexed Bonds
    • Movie Revenues
    • Inflation-Adjusted Wages
  • Cost of Living
    • Calculate Cost of Living
    • Cost-of-living Adj. (COLA)
    • Consumer Price Index CPI
      • Historical CPI
      • Current CPI
      • CPI Release Dates
    • Gas Prices >
      • Cost of Gas
      • Cost of Gas Per Month
      • Gas vs. Oil Price Chart
    • Food Prices 1913 vs 2013
    • Health Insurance
  • Blog
    • Key Inflation Articles
    • International Inflation
    • Historical Inflation Rates for Japan (1971 to 2014)
You are here: Home » Blog » Inflation » November Producer Price Index Declines from 2021 to 2022

November Producer Price Index Declines from 2021 to 2022

Published on December 9, 2022 by Tim McMahon 2 Comments

Typically when we think of inflation, we look at the Consumer Price Index (CPI), which measures prices affecting Consumers. Today we are going to look at the November Producer Price index. According to the U.S. Bureau of Labor Statistics (BLS), “the Producer Price Index (PPI) measures the average change over time in the prices domestic producers receive for their output. It is a measure of inflation at the wholesale level that is compiled from thousands of indexes measuring producer prices by industry and product category.” The index is published monthly, but unlike the CPI, the PPI is subject to adjusting/correcting over the following four months after publication.

The CPI is considered a “lagging indicator“, i.e., it only tells us what has happened to consumer prices, while the PPI is both a leading and a lagging indicator. It is lagging in regard to producer prices, but producer prices go into the cost of consumer prices, so the PPI is a leading indicator for Consumer prices. The following chart shows the annual PPI 12-month percent change over the last 10 years.

November Producer Price Index 2022 Chart

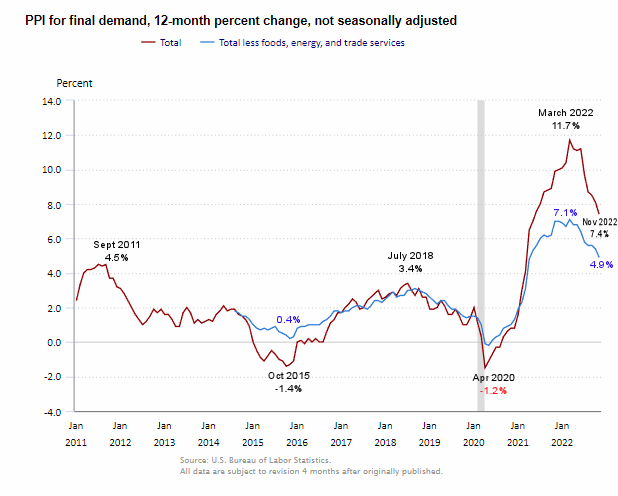
A year ago, the PPI was at 9.9% and still climbing toward the March peak. Now at 7.4%, it is below year-ago levels. According to the Bureau of Labor Statistics, “The PPI reading for the 12-month period ending November 2022. Wholesale inflation slowed less than economists expected in November. Lower fuel and shipping costs were offset by spikes in the cost of food and financial services.”

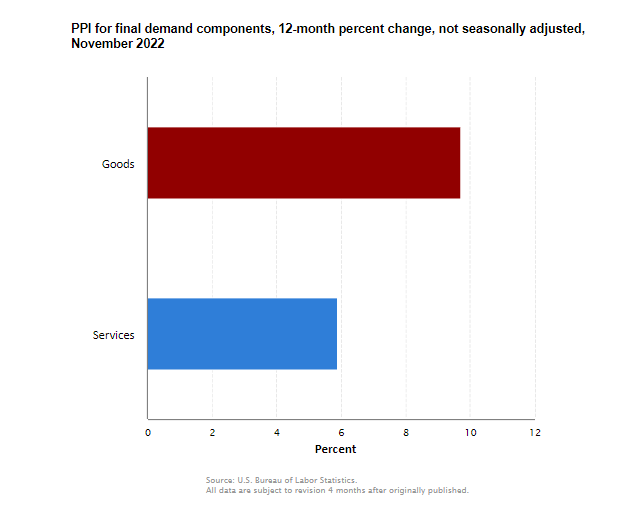
The BLS slices and dices the PPI in a variety of ways so you can get a look at different industries and various product categories, but the major division is between goods and services. Looking at the November Producer Price Index, on a monthly basis, most of the increase in the index resulted from a 0.4-percent advance in prices for services. The index for final demand goods inched up 0.1 percent. So, services increased four times as much as goods in November.
PPI Goods vs Services 1 mo Nov 2022
But when we look at the 12-month picture, we see the opposite, i.e., goods increased 9.7% while services “only” increased by 5.9%.

PPI Goods vs Services 12 mo Nov 2022

Final Demand vs. Intermediate Demand PPI

In addition to the final demand PPI as mentioned above there is also an “intermediate demand” PPI.

So,

What is the difference between the Final Demand PPI and the intermediate demand PPI?

The final demand PPI measures the price that wholesalers sell for. So it is the price just before getting to consumers. The intermediate demand PPI tracks price change for goods, services, and construction products sold to businesses as inputs. So, the intermediate PPI is one step further removed from consumers and is the cost businesses have to pay for their supplies. Naturally, if these costs rise, eventually, they will show up in the final PPI and then in the CPI. So, the intermediate PPI is a leading indicator for the Finished PPI, which is a leading indicator for the CPI.

The good news is that the intermediate PPI has fallen to 3% in November from an unprecedented (in recent history) peak of 59.2% in April 2021.

PPI intermediate goods Nov 2022

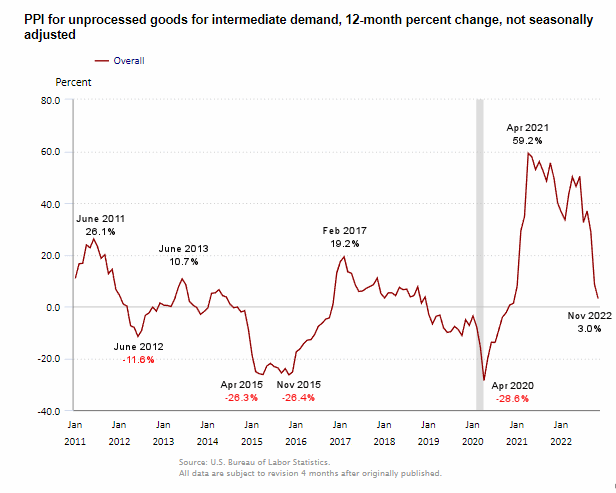
Note that the intermediate goods PPI is much more volatile than the finished goods PPI, with prices frequently less than a year ago (below the zero line) but also with sharp spikes upward. A good supply manager will lock in prices when they are low and draw down supplies when prices are high. Thus the finished goods PPI is much more stable.

A declining Intermediate PPI is good news for producers as their costs will decrease (or at least not increase as fast), so they, in turn, won’t be raising their prices as fast, eventually resulting in a lower inflation rate.

You might also like:

  • Gasoline Prices vs. Wages Over Time
  • Can Businesses Really Set Any Price They Want?
  • Annual Inflation Retreats in October
  • November FED Announcement Rocks Stock Market
  • What is the Reverse Wealth Effect and Why Does the FED Want It?

About Tim McMahon

Connect with Tim on Google+.

  • Web
  • |
  • Twitter
  • |
  • Facebook
  • |
  • LinkedIn
  • |
  • More Posts(410)

Filed Under: Inflation Tagged With: Final, Intermediate, PPI, Producer Prices

Comments

  1. Daniel Davis says

    December 16, 2022 at 4:56 pm

    This seems a bit misleading. PPI is indeed leading compared to CPI, but let’s look holistically at PPI throughout the pandemic.

    PPI
    Jan 2020 PPI 199.3
    Nov 2022 PPI 263.2
    This is a 32.1% increase in PPi in just under 3 years.

    CPI
    Jan 2020 258.68
    No 2022 298.35
    This is a 15.3% increase in just under 3 years

    So PPI has gone up 32.1%, and CPI has gone up 15.3%. In other words, wholesale prices are +32% and retail prices are +15%. This is despite the PPI having actually declined by about 5% in the past 5 months (from 280 to 263).

    I think the obvious conclusion here is that PPI, despite a recent decline, is still pushing CPI upwards very quickly. It’s not even close, and we have no real idea how fast PPI bleeds into CPI.

    Reply
    • Tim McMahon says

      January 12, 2023 at 1:28 pm

      Daniel,
      Good point. So it looks like either the manufacturers were willing to eat some of the price increases during the worst of it or were living off inventory purchased prior to the increases.
      Now they are either trying to make up for previous losses or are using inventory purchased at higher prices. But as inventory costs continue to come down manufacturers can lower their prices as well.

      Reply

Leave a Reply Cancel reply

Your email address will not be published. Required fields are marked *

This site uses Akismet to reduce spam. Learn how your comment data is processed.

Latest Posts

  • Inflation Down In January 2026
  • BLS Inflation Data Delayed
  • Updated Cumulative Inflation Calculator
  • Inflation-Adjusted Silver Prices
  • December Inflation Down Slightly, Not Flat
  • December 2025 Inflation Report for November
  • How Deflation Created the Middle Class
  • October Inflation Numbers Delayed

Sponsored:

As a Seasoned Investor I thought I'd seen everything... But recently I discovered TradingView which has really improved the information I have at my fingertips.~ Tim McMahon, editor

TradingView gives me an edge... including powerful charting tools, real-time market data, and a global community of traders—all in one easy to use platform. It has hundreds of indicators, and even custom scripts for more advanced users, and you don't need to change Brokers just use its seamless brokerage integration... TradingView isn't just a charting tool—it's your full trading command center.

Trade smarter. Trade faster. Check Out TradingView for free.

----------

The Best Place to Buy Your Crypto

Coinbase is the largest Crypto Trading platform in the U.S. and the easiest to use. ~Tim McMahon, editor

Check out Coinbase here

Subscribe Now

eTrends Signup Form

Elliott Wave Resources

Free Elliott Wave Resources

What is Waveopedia?

Waveopedia is EWI’s free, comprehensive index of Elliott wave patterns and terms. Everyone from beginners to experts can benefit from it. It’s a great place to send your followers if they’re new to Elliott waves.

  • Deflation Hits China is the U.S. Next?

  • Why You Must Avoid the Herding Trap

  • Chasing Trends Can Cost You

  • More Education Resources

Post Archives

Home | Articles | Sitemap | Terms of Service | Privacy | Disclaimer | Advertise With Us

Copyright © 1996-2026 · Capital Professional Services, LLC · Maintained by Design Synergy Studio · Admin

Do Not Sell My Personal Information