
Quantitative Easing was initially considered inflationary but after its first usage, it didn’t appear to be. Is this always the case? Is Quantitative Easing really inflationary? Will the Quantitative Easing of 2020-2021 result in more inflation? That is what we are going to look at here. ~Tim McMahon, editor
At the height of the 2008 mortgage crisis the FED came up with a revolutionary idea to handle the crisis and that was called “Quantitative Easing (QE)”. But before we delve into that let’s look at what brought us to that point.
Before Quantitative Easing
Prior to the 2008 crisis, the housing market was on a tear (much like it is today). The banks were lending at a furious pace and making massive amounts of money from mortgages. But rather than keeping those mortgages on the books and assuming the risk of bad loans, they were bundling those loans into “mortgage-backed securities” sort of like a mutual fund for mortgages. The theory was that although a single mortgage might be risky, by diversifying across multiple mortgages the risk would be lower. At the time only 1 or 2 percent of homeowners were defaulting on their mortgages.
The problem started when lenders began making NINJA loans i.e. “no income, no job, no assets” in other words they stopped worrying about qualifying buyers and loaned money to virtually anyone (i.e. there were stories of unemployed illegals buying multiple homes).
Why?
1) Because lenders were off-loading the risk to someone else.
2) Lenders were making lots of money in origination fees.
3) Lenders could justify it because housing prices were going up so quickly that even high-risk borrowers had substantial equity in a couple of years.
Then the inevitable happened and everyone had a house (or two) so the demand for housing dried up and prices stopped climbing. And then they started falling.
What Happened When Housing Prices Started Falling
Once housing prices were no longer climbing, marginal borrowers who only bought because they expected to profit by “flipping” couldn’t afford to carry the mortgage, so the foreclosures began. This drove prices down and soon other borrowers who had borrowed 100% to finance their home found that they were “underwater” i.e. the value of their “asset” was declining and they owed the bank more than the house was worth so they began defaulting. And then the housing market collapsed. Once the default rate began rising from recent averages the value of the mortgage-backed securities also began plummeting. And the banks that held these mortgage-backed securities no longer had the necessary reserves so the FED stepped in by creating a new tool they never had before, i.e. Quantitative Easing.
The FED’s New Tool — Quantitative Easing
With the banking system teetering on the eve of destruction due to the collapse of Mortgage-Backed Securities the FED had to do something. So they decided to buy up all these bad mortgage-backed securities (MBS) that were ruining the balance sheets of the banks. So as if by magic, the banks’ balance sheets went from owning bad MBS’ to “good” treasury debt. And the banking crisis was averted.
Now at the time, many believed that this would be a massively inflationary event. But as it turned out that isn’t what happened. Back then I argued that it wouldn’t be inflationary because:
- The money supply was contracting due to a crashing stock market*
- All the money being created by the FED was simply taking the money supply back to where it was before the crash.
- Low-cost Chinese production had been putting downward pressure on U.S. prices for decades.
*Generally, the stock market is not considered part of the money supply but I argue that it should be considered because it is liquid, people consider it part of their wealth, and they will tap into it in times of need.
Causes of Inflation
There are a variety of causes of inflation.
- Demand Outstripping Supply
- Excess Money Supply
Demand can outstrip supply for a variety of reasons but most are temporary. Such as a climate event that shuts down refineries or destroys a crop. So because of limited commodity supply more money is chasing fewer goods so consumers bid up the price of goods. But before long the free market corrects itself (by increasing production, or shipping goods from elsewhere), prices return to normal, and the event’s importance recedes.
Money Supply Issues on the other hand are more permanent. If the FED increases the money supply and the Gross Domestic Product (GDP) stays the same, inflation results because more dollars are chasing the same amount of goods so the price of the majority of goods rises to soak up the new dollars. After a bit of fluctuation prices settle at this new equilibrium and everything costs more.
In the above video, Joe Brown gives an excellent explanation of why today’s Quantitative Easing (QE) will have different results than the QE of 2008.
Why This Time IS Different
Typically, when someone says “This time is different” they are trying to justify why something that had bad results before will have good results this time (often regarding the stock market). But in this case, it is the opposite. Quantitative Easing rescued the Banks and stopped Deflation due to the 2008 crash and it wasn’t inflationary (because of a massive contraction of the money supply i.e. deflationary forces). This created the illusion among Congress and people at large that inflation was a concern of the past and no longer a problem.
But this time around there are no new deflationary forces at work, so when the FED buys 4 TRILLION in assets it IS pumping up the money supply and it WILL result in inflation. Shutting down world production due to COVID fears triggered a stock market collapse, so officials jumped in with their new QE tool to prevent the carnage. And the market quickly rebounded to previous levels, creating the shortest recession in history. But the FED continued QE. The FED assumed that the emerging signs of inflation were primarily due to reduced supply issues and labeled them “transitory”. But by this point, the money supply had already increased beyond previous levels and the FED continued QE throughout 2021 despite signs that it was not transitory.
The FED Hasn’t Even Let Off the Gas
If we think of Quantitative Easing as stepping on the accelerator and the more money they create as pressing harder on the pedal, then “tapering” is easing off the gas. It isn’t the same as stepping on the brakes. Stepping on the brakes would be either raising interest rates or Quantitative Tightening (QT). QT happens when the FED actually reduces assets as it did in 2018.
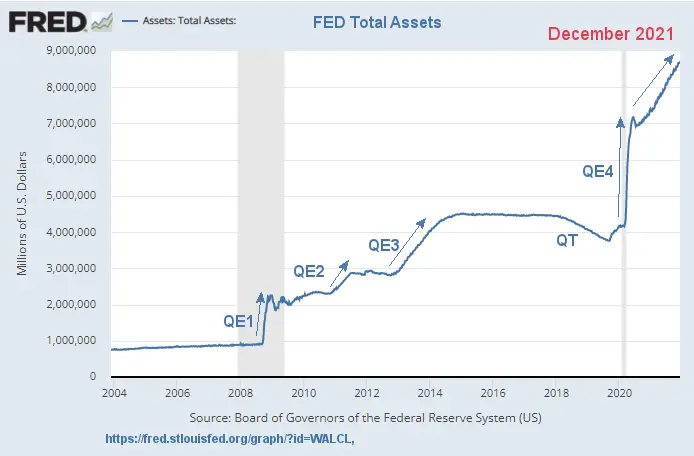
The FED went so far as to promise that they would not even consider cutting the rate of increase until 2022. So, in spite of heading toward an inflationary cliff, they refuse to let off the gas… let alone step on the brakes.
Money Supply and Inflation (Consumer Price Increases)
The other thing we need to consider is that M2 can increase without raising consumer prices if:
- GDP increases
- The excess liquidity flows into the stock market
- The excess liquidity flows overseas
So assuming a 2.5% increase in GDP there would only be one point since 1960 where the M2 money supply was lower than the GDP. (See M2 Money Supply below). Theoretically, if the money supply increased at 2.5% and the GDP increased at 2.5% consumer prices should be relatively flat. So in effect, if the excess liquidity flowed into the new production prices would stay the same. Believe it or not, the “natural state” of things is for prices to decrease if the money supply was stable prices would actually go down as production increased.
If the “excess liquidity” flowed into the stock market or overseas, Americans would not see price increases either.
Money Supply: Now vs Then
If we look at the annual percent change in the M2 money supply since 1960, we can see that it has not been negative during this period. (But remember that M2 doesn’t include the stock market).
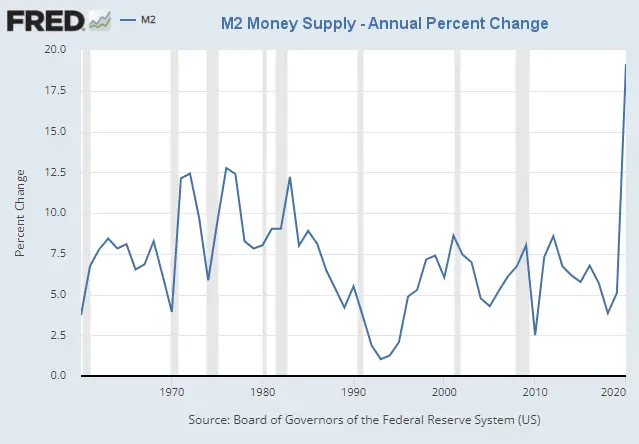
Looking at the M2 money supply we can see that throughout the 2008-2009 recession rate of M2’s increase was declining despite the FED’s QE. Finally in 2010 M2’s percent change bottomed at about 2.5%. We can also see that back in the 1970s when inflation was in the double digits M2 growth reached 12.5% a couple of times. Remember that it takes at least 12-18 months for M2 growth to spread throughout the economy and generate inflation.
Now let’s look at what M2 did in 2020. We can see that it was waaaay over 12.5% reaching nearly 20%. So as we approach the 12-month line we can see inflation increasing to levels we haven’t seen since the 1980s.
 Quantitative Easing IS Inflationary If…
So, in conclusion, we can see that Quantitative Easing is inflationary but it can be counteracted by deflationary forces and as long as the FED gets the mix right the economy can be relatively stable. However, we don’t know what the long-term effects of having all that debt on the FED’s balance sheet will be. And if the FED doesn’t get the mix right Quantitative Easing could result in massive inflationary forces.
Articles Referenced Above:
- What is Quantitative Easing?
- Inflation-Adjusted Housing Prices
- How Nixon’s Revolutionary Move Affected Inflation for 50 Years
- What is Deflation
- What is Quantitative Tightening
- Millennials Have Never Seen Inflation This High
Leave a Reply