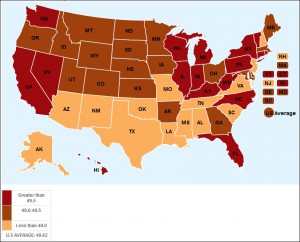
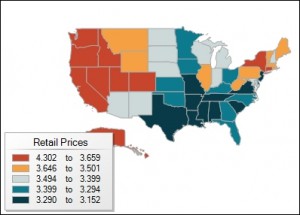
Yesterday we looked at the BLS' release of the July Inflation numbers and that lead to a discussion of gasoline prices and the correlation between high gas prices and politics. The first thing we looked at was the graphic of gasoline prices by state. And then we looked at the political landscape based on the percentage of the state that voted Democrat or Republican. We looked at the following graphic and noted that "the more blue the more Democrat and the more red the more Republican (which by the way is backwards compared to the rest of the world) and incidentally almost exactly backwards for the gasoline chart as well. There appears to be a very high correlation between high gas … [Read more...]
BLS Releases July Inflation Numbers
The U.S. Bureau of Labor Statistics released their inflation numbers for July on August 19th. The basic summary they emailed read as follows: CPI for all items rises 0.1% in July as food prices rise but energy prices decline 08/19/2014 On a seasonally adjusted basis, the Consumer Price Index for All Urban Consumers increased 0.1 percent in July after rising 0.3 percent in June. The index for all items less food and energy rose 0.1 percent in July, the same increase as in June. If you just read that what impression would you get? Maybe that inflation is UP? At least that is what the headline implies. But then it says, energy prices are down. And it also implies … [Read more...]
Inflation Flat in June 2014
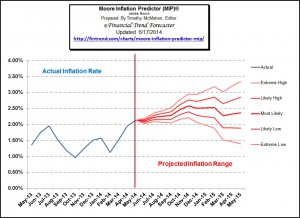
The Bureau of Labor Statistics released their Consumer Price Index (CPI) for June of 2014 on July 22nd. Based on the rounded numbers this would result in an Annual Inflation Rate of 2.1% the same as last month (May). But here at Inflation Data we look at it to two decimal places and based on that we can see that in May the rate was actually 2.13% and in June it fell ever-so-slightly to 2.07%. Many will say that it isn't statistically significant and it quite possibly isn't but it is quite possible that inflation is heading down again. Time will tell. I find it interesting that both the WSJ and Reuters top articles on inflation today say inflation is "Up" WSJ:Spike in Gas Costs Pushes Up … [Read more...]
Japanese Inflation Higher than U.S- First Time Since 1978
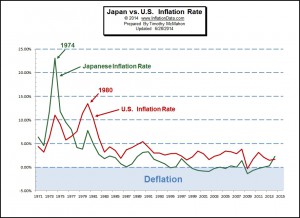
Core inflation in Japan was 3.4% in May while U.S. inflation was officially, only 2.13%. This was the fastest rise in Japanese prices since April 1982. In the 1970's inflation was bad in the U.S., but it was much worse in Japan. Every rise in U.S. inflation was multiplied in Japan, for instance, the average annual U.S. inflation rate, in 1974, was 11.04% while in Japan it was more than twice as high at 23.10%. But in 1978 a strange thing happened, Japan got its inflation under control and Japanese inflation dropped down to 4.2% while U.S. inflation remained at 7.59%. And by1979, Japanese inflation had fallen to 3.8% while U.S. inflation climbed to 11.35%. In 1980, although Japan had a … [Read more...]
US Consumer Prices Rose 0.4% in May to 2.13%
The U.S. Bureau of Labor Statistics released the Consumer Price Index (CPI) for the month of May today, at 237.900 it was up sharply from April's 237.072. This resulted in monthly inflation increasing 0.35% from April to May. Thus the annual inflation rate jumped from 1.95% in April to 2.13% in May. Key gainers on a monthly basis were fruits and vegetables which gained 1.4% over the month and account for 1.352% of the total CPI index . Airfares were up a whopping 7.4% as the summer season got under way which accounts for 0.77% of the total CPI. The other major gainer was electricity which increased 4.1% and accounts for 2.832% of the index. Meats, poultry, fish, and eggs were also up … [Read more...]
Oil, Petrodollars and Gold
For thousands of years gold has been synonymous with money, albeit with periods where governments mandated other mediums of exchange. Therefore, throughout history prices were measured in gold rather than in dollars, Rubles or Yen. By looking at the chart to the right you can see the current price of gold over the last 24 hours in terms of dollars. As of this writing it is $1256.70 per troy ounce but gold has fallen from its monetary pedestal and now fluctuates just as other commodities. The Fall of Gold and Rise of the Dollar Shortly after assuming office in 1933, President Franklin Roosevelt perpetrated one of the greatest frauds ever on the American public. He knew that the … [Read more...]
What are Excess Reserves and How Could they Spark Inflation?
How can you possibly have too many reserves? You would think that the more reserves the healthier the institution and so there would be no such thing as "excess reserves". We've mentioned this in previous articles such as FED Looks for New Ways to Crank Up Money Supply and How “Excess Reserves” and the Money Multiplier Could Trigger Inflation but excess reserves are in the news once again as Philadelphia Federal Reserve Bank President Charles Plosser says that that "excess reserves" could push inflation dramatically higher. Well, we have been telling you that for quite some time so it shouldn't be news to long time readers. But if you are new to InflationData... What are Excess … [Read more...]
Unique Inflation Characteristics of the Decades in the Early 1900’s
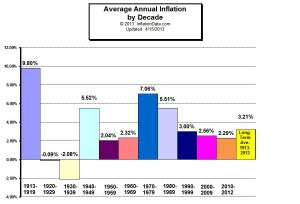
The Beginning of Inflation Tracking in the U.S. Contrary to popular belief the U.S. didn't begin tracking inflation in 1913. Inflation tracking actually began in 1917 but once the index was constructed inflation rates and the Consumer Price Index for the prior years were reconstructed back to 1913 from price data available at the time. In 1917 the U.S. joined World War I and one of the prime motivators for developing the CPI was rapidly rising prices due to the war effort. The government was pumping money into the shipping centers and the workers were demanding cost-of-living adjustments for wages. Total cumulative inflation for the period of 1913 through 1919 was an astronomical … [Read more...]
How to Grow a Small Account into a Big Account
Today we've got a video for you from millionaire trader John Carter that shows: The difference between trading for income vs. trading for growth The # 1 job that every trader has to accomplish Why you don’t want to focus on being right Why position sizing may be the most important factor for small accounts Check out the video here … [Read more...]
Various Methods of Calculating Inflation
Why are There So Many Different Ways to Calculate Inflation? We've all heard the old saying, "Figures don't lie but liars figure" or perhaps "You can make numbers say anything you want". Both of these sayings contain the underlying assumption (or at least possibility) of malicious intent. But even if you have the raw data and just want to get at the truth, number calculations can present difficulties because the answer you get can depend on how you analyze it. For instance, you would think that if you want to know the "average" income of a group of 10 people it would be easy to calculate. And if all the incomes are relatively closely grouped it is easy... simply add them all up and … [Read more...]

