
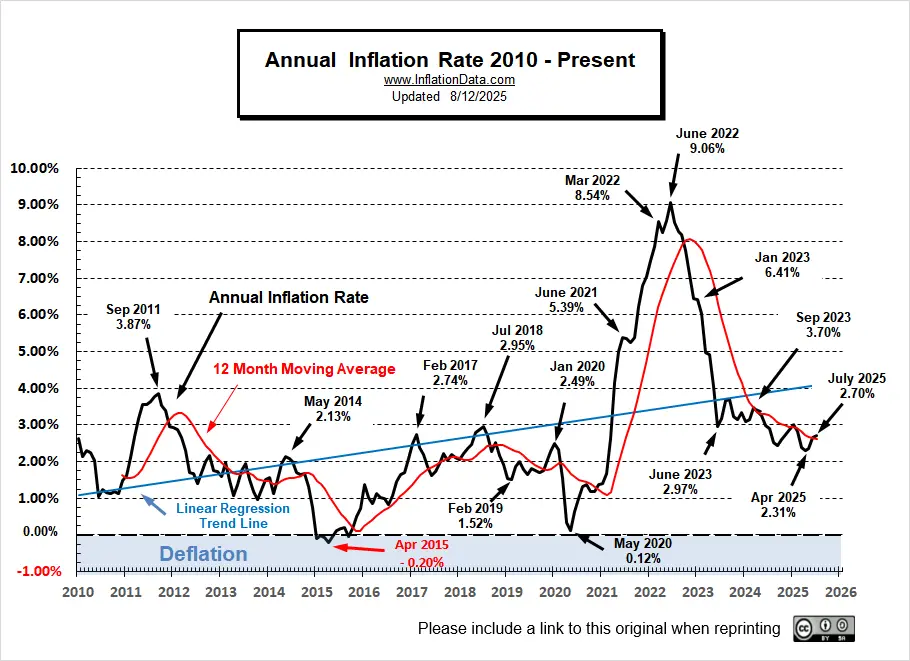
The U.S. Bureau of Labor Statistics released its July 2025 Inflation report on August 12th, 2025. The report showed that Annual Inflation was unchanged at 2.7%.
Calculated to two digits, it was 2.67% in June and 2.70% in July. So, although the BLS says it was unchanged it was actually up VERY slightly. The market responded positively with the NYSE up 226.57 points.
July’s Inflation Prediction:
At 2.70%, July inflation numbers came in between last month’s “likely low” and “extreme low” projections, which is about as good as we could hope for.
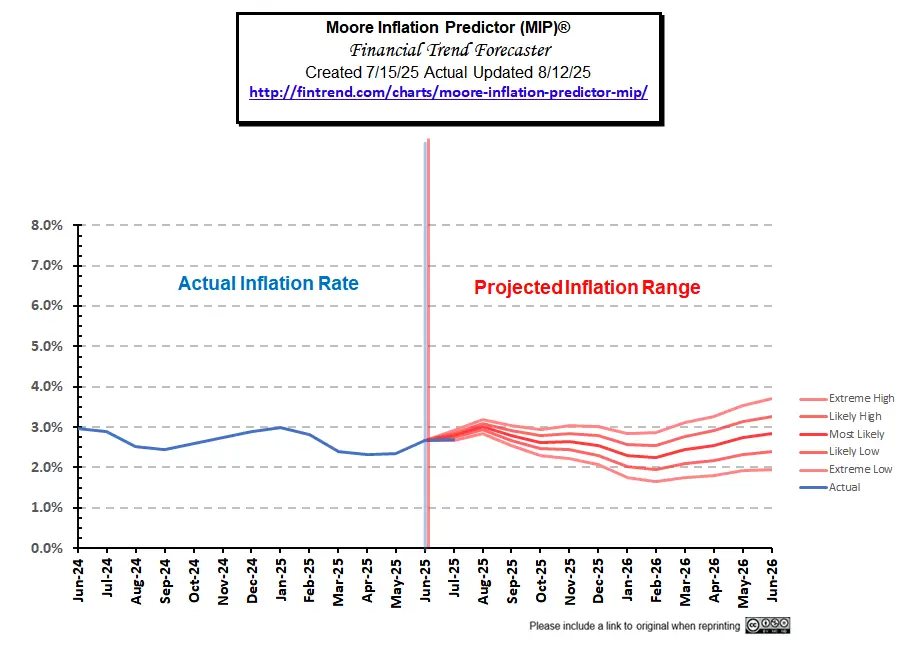
Go here to view our current MIP projection.
July 2025 Inflation Summary:
- Annual Inflation rose from 2.67%% to 2.70%
- CPI Index rose from 322.561 to 323.048
- Monthly Inflation for June was 0.34%% and July was 0.15%
- Monthly Inflation for June 2024 was 0.12%%
- Next release September 11th, 2025
Annual Inflation Table

BLS Commentary:
“The Consumer Price Index for All Urban Consumers (CPI-U) increased 0.2 percent on a seasonally adjusted basis in July, after rising 0.3 percent in June, the U.S. Bureau of Labor Statistics reported today. Over the last 12 months, the all items index increased 2.7 percent before seasonal adjustment.
The index for shelter rose 0.2 percent in July and was the primary factor in the all items monthly increase. The food index was unchanged over the month as the food away from home index rose 0.3 percent while the food at home index fell 0.1 percent. In contrast, the index for energy fell 1.1 percent in July as the index for gasoline decreased 2.2 percent over the month.”
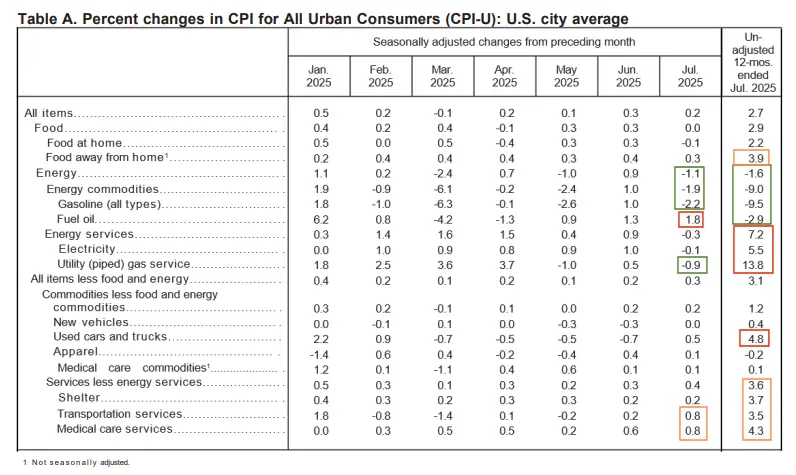
Looking at table A below we can see the best performers are in green boxes, the worst are in red boxes, and the moderately bad are in orange boxes.
On an annual basis energy overall is still down, with gasoline down 9%. But Utility supplied Energy (Energy Services) was up significantly. Utility gas (natural gas) was up 13.8%. However, it was down for the month by -0.9%. And Electricity was up 5.5% on an Annual basis.
Food away from home, and Shelter, Transportation and Medical Care services have moved from red to orange.
All Items vs. Less Food and Energy
Although these “Seasonally Adjusted” numbers are slightly different than those presented by the BLS, the following chart from the Federal Reserve shows the gap between inflation with and without Food and Energy. Comparing the two we can see how much food and energy contribute toward overall inflation.
If the blue line is above the red line, food and energy, add to the overall inflation rate. But if blue is below the red line, they are actually mitigating overall inflation.Some commentators have expresseed concern that “Core Inflation” (i.e., without food and energy) is above 3%.
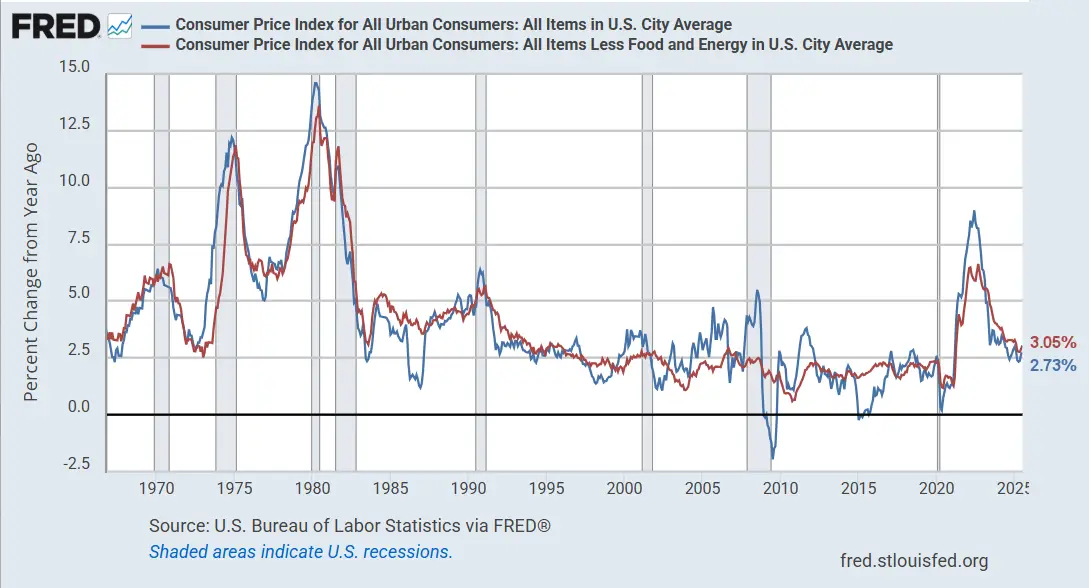
Source: St. Louis FED
FED Monetary Policy
July 2025 Summary:
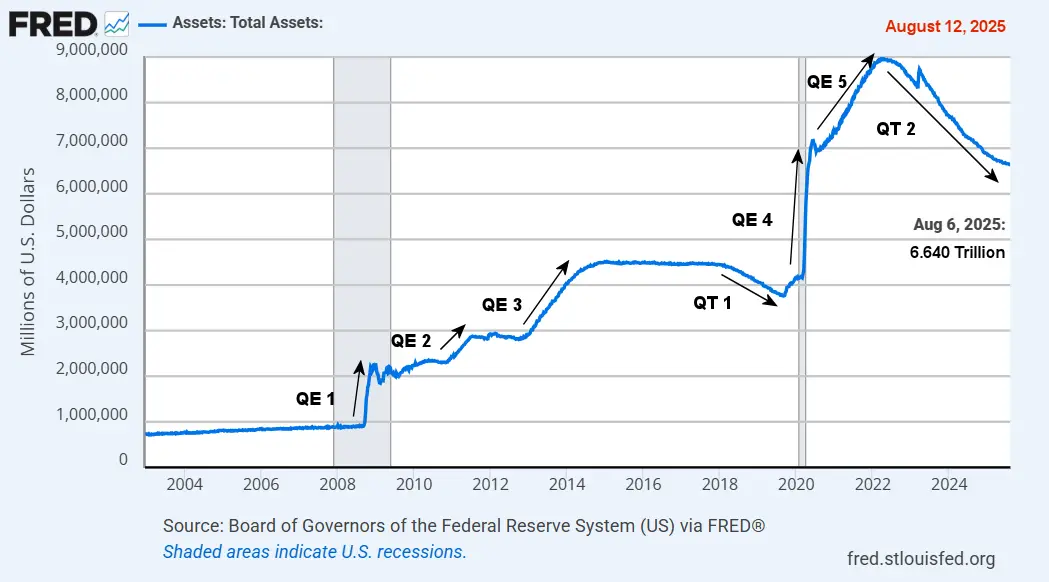
- FED Assets are Falling
- M2 Money supply is rising
- FED Funds Rates Remain at 4.33%
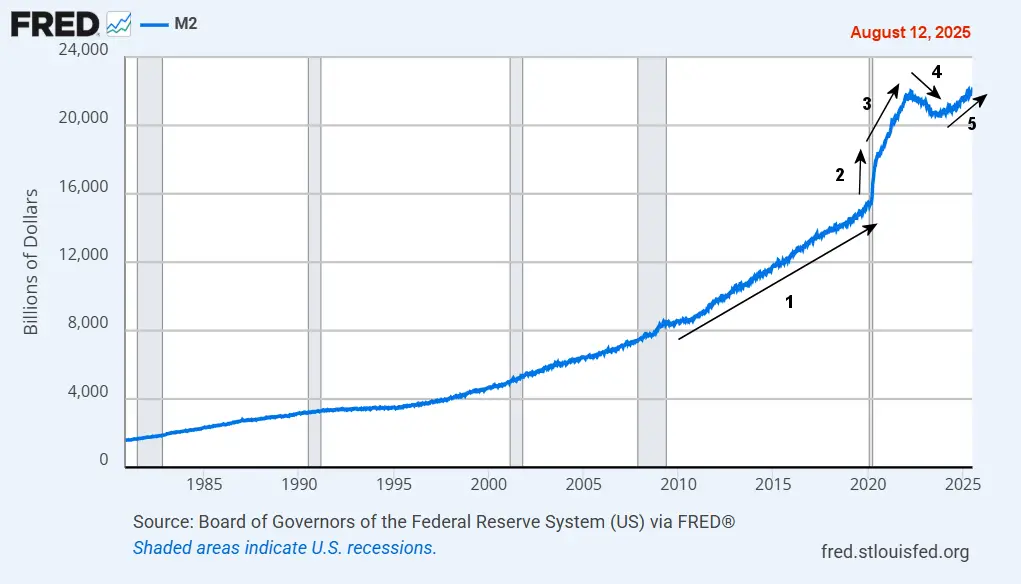
FED Assets and M2 Money Supply
M2 Money Supply
BUT… rather than decline as FED assets are doing, M2 returned to the same upward slope of increase as from 2012-2020 (#5).
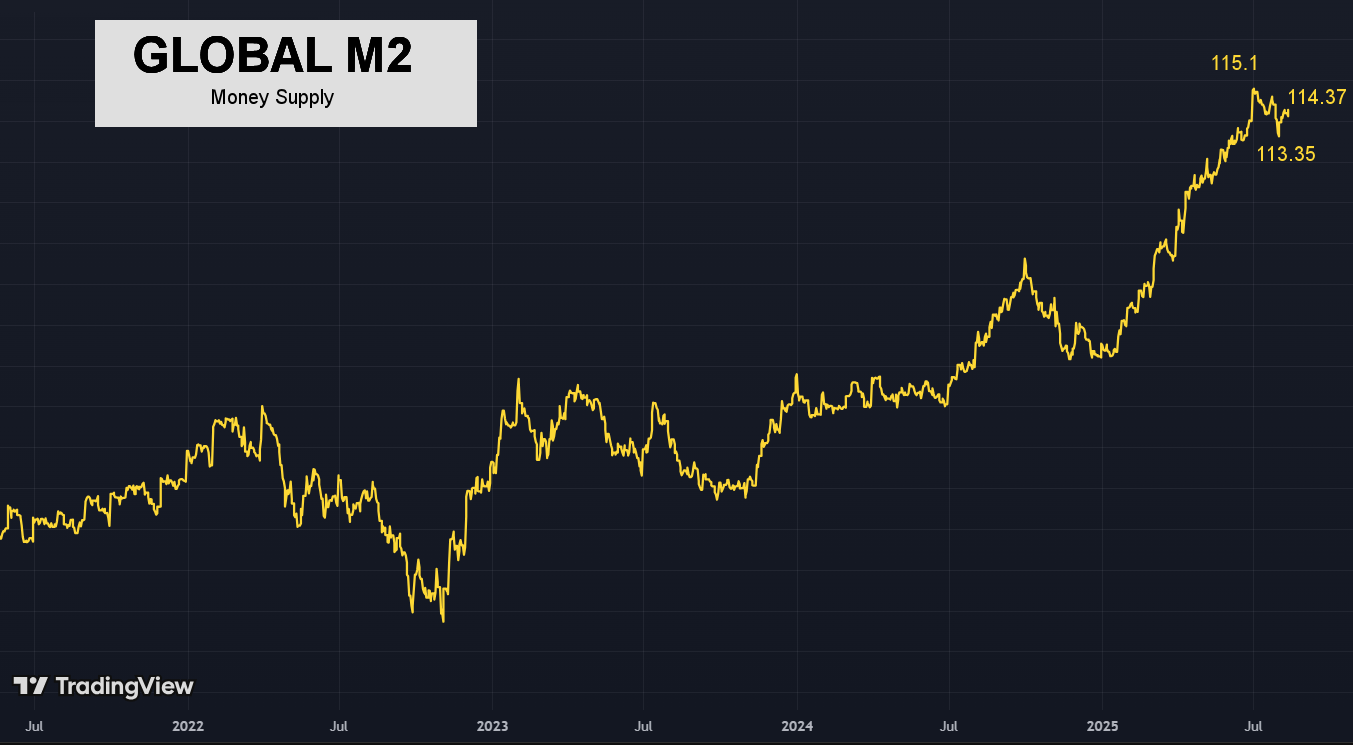
Global M2
The Global M2 Money Supply is the composite of all the major countries’ money supplies. Generally, an increase in the money supply will result in a rising stock market with a 2 to 4-month delay. Starting at just over 100 in January 2024, it is now above 114, or a 14% increase in about 19 months. Although it only rose slightly during the first half of 2024 it rose sharply in the 3rd quarter but then fell sharply in the 4th quarter of 2024. Then, in 2025, global M2 has skyrocketed. It peaked at 115.1 in early July, and fell to a low of 113.35 before reaching 114.37. The overall trend is up sharply for 2025, which is a good indicator that global inflation is rising rapidly.
FED Funds Rate
The chart below shows the rapid increase in interest rates from February 2022, when they were just 0.08% to a year later, when they were at 4.57%. From August 2023 through August 2024, the FED maintained a stable Funds Rate at 5.33%. Then, in September, the FED announced a 1/2% reduction in the range. October numbers show the rate at 4.83%. At its November meeting, the Fed lowered the federal funds target range by 25 basis points to 4.5%-4.75%, with the actual rate coming in at 4.48% in December. On December 19, 2024, they lowered the target range to 4.25 – 4.50%, since then, the FED held its Funds rate steady from January through July 2025 at 4.33%. At the most recent FED meeting, Chairman Powell announced that the direction of inflation and Unemployment were still unclear, so the FED is holding rates steady.

Inflation Chart
Monthly Inflation Compared to Previous Years:
The monthly inflation rate for July 2025 was 0.15% slightly more than July 2024’s 0.12%.
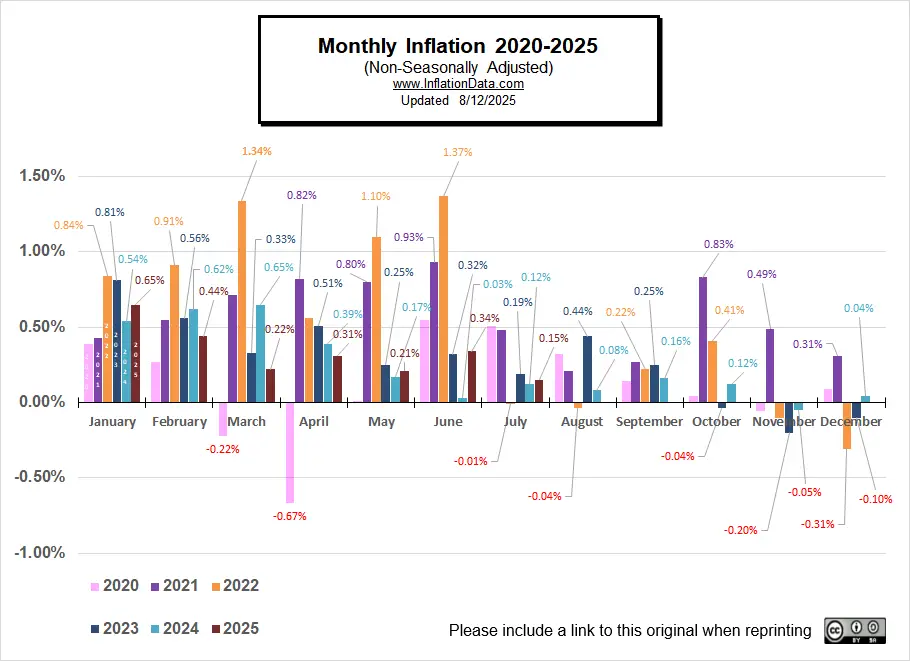
See: Monthly Inflation Rate for more information and a complete table of Unadjusted Monthly Rates.
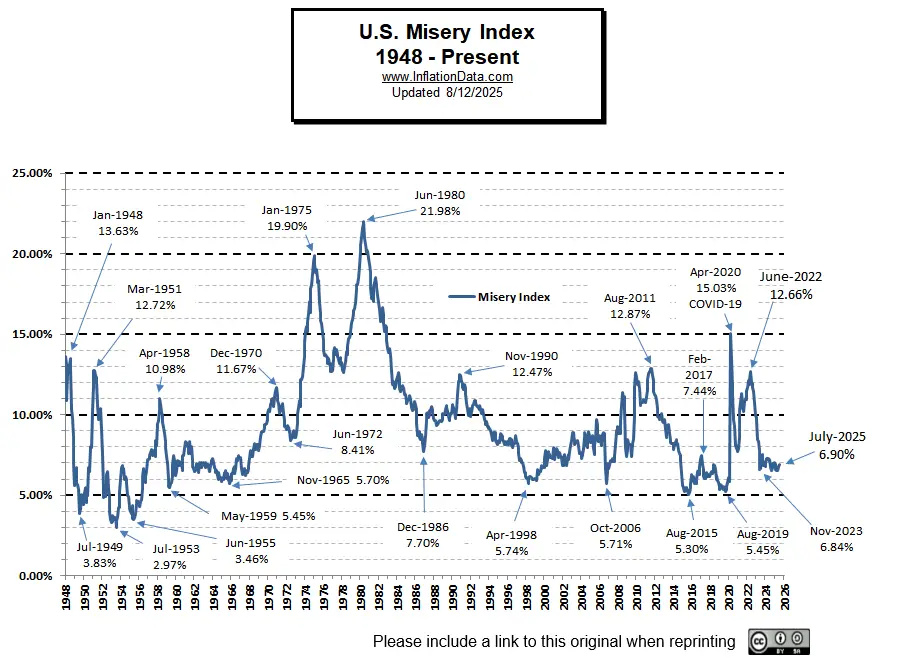
Misery Index
Unemployment 4.2% + Inflation 2.70% = 6.90%
Read More on the Misery Index…
Crypto Rate of Change
ETH is on a tear after generating a buy signal a couple of months ago. BTC is still a Buy as well.

For more information see, Crypto ROC.
Here are some articles you might enjoy in case you missed them:
Read more on UnemploymentData.com.
- Blue-Collar Wages Surge in 2025
- Does Raising The Minimum Wage Make A Substantial Difference?
- Would More Jobs Help Social Security?
From InflationData.com
- AI Is Deflationary But Its Energy Demand Could Fuel Inflation
- FED’s Semiannual Monetary Policy Report
- What Is the Trimmed Mean CPI and What Is It Good For?
- The Truth About Why Gold Is Surging
- FED Holds Steady at May Meeting
- How To Recalculate Retirement for Today’s Economy
From Financial Trend Forecaster
- Moore Inflation Predictor
- NYSE ROC
- NASDAQ ROC
- ETH and BTC Buy Signal
- Is the Crypto Pull-Back Serious?
- The Truth About AI and Electricity Capacity
- 3 Big Crypto Bills in Congress
- Big New Tax Deductions for Seniors and Others in 2025
- Trump Pushes Crypto for Mortgages
- Will AI And Bitcoin Mining Balance Or Destroy the Grid?
- Amazon and Walmart Consider Issuing Their Own Stablecoins
- Breaking Free from China’s Rare Earth Monopoly
From Elliott Wave University
- This Forecasting Tool Nailed the S&P Turns
- Warren Buffett isn’t buying — and that says a lot.
- Debt Ceiling Drama
- Stock Market Signal: Only 3 Times in 47 Years!
- Tesla’s Troubles — Is it Musk or is it More?
From OptioMoney
- What is a “Haircut” in Financial Terminology
- How To Protect Your Wallet When You’re Just Starting Out
- Consumer Culture Contrasting Spending Habits in the US and Europe
- Financial Considerations When Moving to Florida
From Your Family Finances
- YFF has a new editor, so we won’t be posting new links anymore.
Read more on InflationData.com.
Leave a Reply