
The (Zimbabwean) Dollar – The Point of No Return
By John Lee, CFA
Last week, Zimbabwe slashed 12 zeros from its currency as hyperinflation continued to erode its value, the country’s central bank announced in late January.
The government instituted price cuts to arrest inflation. As time went by, it became apparent the forced price cuts cause bare shelves in shops and many businesses to close.
“Even in the face of current economic and political challenges confronting the economy, the Zimbabwe dollar ought to and must remain the nation’s currency, so as to safeguard our national identity and sovereignty… Our national currency is a fundamental economic pillar of our sovereignty,” said Gideon Gono, governor of the Reserve Bank of Zimbabwe.
Gono has sent in the police to arrest businessmen for failing to reduce their prices. On one occasion, he personally visited shop owners in Harare to demand they lower prices. Despite these efforts, inflation in Zimbabwe remains the world’s highest.
“Accordingly, therefore, this monetary policy statement unveils yet another necessary program of revaluing our local currency, through the removal of 12 zeros with immediate effect.”
The move means that 1 trillion in Zimbabwe dollars now will be equivalent to one Zimbabwe dollar.
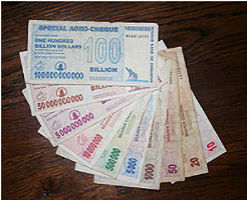
A selection of Zimbabwe Reserve Bank bearer cheques printed between July 2007 to July 2008 (now expired) illustrate the hyperinflation rate in Zimbabwe.
Zimbabwe Money supply (2006-2008)
Gono has printed enormous quantities of money against the advice of economists, but with full support from Robert Mugabe. As predicted by the textbook quantity theory of money, this practice has devalued the Zimbabwean dollar and caused hyperinflation.
On 16 February 2006, Gideon Gono, announced that the government had printed ZW$20.5 trillion in order to buy foreign currency to pay off IMF arrears. In early May 2006, Zimbabwe’s government announced that they would produce another ZW$60 trillion. The additional currency was required to finance the recent 300% salary increase for soldiers and policemen and 200% increase for other civil servants. The money was not budgeted for the current fiscal year, and the government did not say where it would come from. On 29 May, Reserve Bank officials told IRIN that plans to print about ZW$60 trillion (about US$592.9 million at official rates) were briefly delayed after the government failed to secure foreign currency to buy ink and special paper for printing money.
In late August 2006, 3 zeros were chopped off the old currency to form the new dollar. It was reported that about ZW$10 trillion old dollars (22% of the money supply) had not been exchanged for revalued dollars.
On 27 June 2007, it was announced that central bank governor Gideon Gono had been ordered by President Robert Mugabe to print an additional ZWD$1 trillion to cater for civil servants and soldiers’ salaries that were hiked by 600% and 900% respectively.
On 28 July 2007, it was reported that Mugabe has said that Zimbabwe will go on printing money if there is not enough for underfunded municipal projects.
On 3 September 2007, it was reported that that the black market in Zimbabwe is once again booming despite price controls. People who previously were employed for a paltry US$11 (ZW$2 Million) a month are now able to turn as much as US$166 (ZW$30 Million) just through black-market trading.
On 24 November 2007, it was reported that the money supply was now $58 trillion revalued Zimbabwean dollars (ZWD) ($41 million US at parallel rates). However, Zimbabwe banks could only account for $1 to $2 trillion of those dollars, meaning that members of the public were holding $56 to $57 trillion in cash.
On 4 January 2008, it was reported that the money supply had been increased by $33 trillion (to $100 trillion) revalued Zimbabwean dollars (ZWD).
On 21 January 2008, it was reported, by Gideon Gono, that the money supply had been increased to ZW$170 trillion since the middle of December. Further, Gono expected it to reach $800 trillion by 28 January 2008.
On 1 March 2008, it was reported that documents obtained by The Sunday Times show the Munich company Giesecke & Devrient (G&D) was receiving more than €500,000 (£382,000) a week for delivering banknotes at the astonishing rate of Z$170 trillion a week.
“The regime is surviving by printing money,” said Martin Rupiya, professor of war and security studies at the University of Zimbabwe. “At this stage, there is no other way.”
On July 1, 2008, Giesecke & Devrient decided they would no longer print banknotes for Zimbabwe, bowing to pressure from the German government.
In the Guardian, on 18 July 2008, a report on Zimbabwe’s inflation said that an egg costs ZW$50 billion (GBP 0.17, USD 0.32). It also showed a monthly war pension currently is ZW$109 billion (GBP 0.37, USD 0.74), shops can only cash cheques if the customer writes double the amount, because the cost will go up by the time the cheque has cleared, and people can only withdraw a maximum of ZW$100 billion from cashpoints.
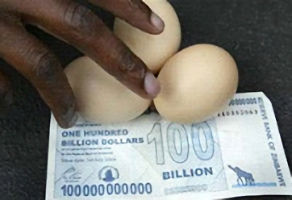
Zimbabwe’s $100 billion banknotes with the number of eggs it could purchase on its release date
On 23 July 2008, an Austro – Hungarian company based in Vienna confirmed that it is providing the Reserve Bank of Zimbabwe with the licenses and software required to design and print Zimbabwe currency.
On 24 July 2008, the Reserve Bank of Zimbabwe announced that “appropriate measures are being put in place to address the current setbacks being faced on the currency front, as well as on financial and accounting systems.” It promised that in “the next few days” it would institute changes to the minimum cash withdrawal limits and IT systems’ constraints. Currently, the government limits cash withdrawals to ZW$100 billion per day, which is less than the cost of a loaf of bread. IT systems cannot handle such large numbers; the automated teller machines for one major bank give a “data overflow error” and freeze customer’s attempts to withdraw money with so many zeros. That same day, the Institute of Commercial Management reported that ZW$1.2 trillion is worth the same as one British pound.
From January to December 2008, the money supply growth rose from 81,143 percent to 658 billion percent.
First Zim Dollar
| Date | Exchange Rate |
| 1983 | 1 |
| 1997 | 10 |
| 2000 | 100 |
| June 2002 | 1,000 |
| March 2005 | 10,000 |
| January 2006 | 100,000 |
| July 2006 | 500,000+ |
Second Zim Dollar
| Date | Exchange Rate |
| Aug 2006 | 650 |
| Sep 2006 | 1,000 |
| Dec 2006 | 3,000 |
| Jan 2007 | 4,800 |
| Feb 2007 | 7,500 |
| Mar 2007 | 26,000 |
| Apr 2007 | 35,000 |
| May 2007 | 50,000 |
| Jun 2007 | 400,000 |
| Jul 2007 | 300,000 |
| Aug 2007 | 200,000 |
| Sep 2007 | 600,000 |
| Oct 2007 | 1,000,000 |
| Nov 2007 | 1.500,000 |
| Dec 2007 | 4,000,000 |
| Jan 2008 | 6,000,000 |
| Feb 2008 | 16,000,000 |
| Mar 2008 | 70,000,000 |
| Apr 2008 | 100,000,000 |
| May 2008 | 777,500,000 |
| Jun 2008 | 40,928,000,000 |
| Jul 2008 | 758,530,000,000 |
Third Zim Dollar
| Date | Exchange Rate |
| Aug 2008 | 1,780 |
| Sep 2008 | 590,000 |
| 7 Oct 2008 | 2,300,000 |
| 14 Oct 2008 | 10,700,000 |
| 21 Oct 2008 | 122 Billion |
| 28 Oct 2008 | 251 Billion |
| 8 Nov 2008 | 663 Trillion |
| 12 Nov 2008 | 13 Quadrillion |
Critics have noted that most of Gono’s monetary policy statements in the past have had biblical references. Notably, he usually ends in policy statements to the Parliament of Zimbabwe thus: “In the Lord’s hands, I commit this Monetary Policy Framework for our economic turnaround.”
What does this have to do with the US Dollar?
 The US dollar has several forces going against it.
1) Financial Bailout
In the last 5 months, the Federal Reserve has printed over $1 trillion to buy out soured mortgage assets from private enterprises. http://www.federalreserve.gov/releases/h41/Current/
(The cut off for the chart below is October 2008 at $1.5 trillion, today the figure stands at $1.8 trillion )
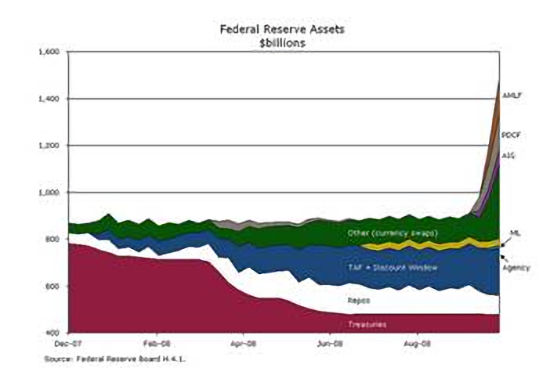
AMLF: Asset-backed commercial paper (ABCP) Money market mutual fund (MMMF) Liquidity Facility
PDCF: Primary Dealer Credit Facility (Expanded Greatly)
AIG: AIG bailout
TAF: Term Auction Facility (Bailout for Banks, and GSE’s with bad assets)
To legitimize the process, the Fed puts
– the toxic mortgage notes it bought as “assets”,
– the money it created out of thin air and deposited at Goldman’s account as “liability”
I am not sure which of this qualifies as “assets”. And we are not finished yet as the new banking rescue program from Treasury Secretary Geithner is to be unveiled shortly. I wish I am an institution so I can sell to the Fed, my penny stocks for $thousands which I originally bought for.
2) Fiscal Stimulus:
President Obama $838 billion stimulus package passed the Senate this week.
The money was not budgeted for the current fiscal year, and the government did not say where it would come from. The country will go on printing money if there is not enough for underfunded municipal projects and entitlement. The regime is surviving by printing money. At this stage, there is no other way.
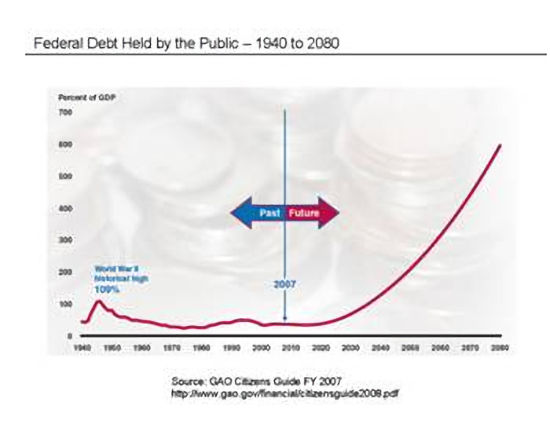
3) Precarious Treasury Position
Money is regulated by an independent Fed, surely the US government doesn’t just print. Or does it?
Deficit spending came from borrowing by the US Treasury. As of February 5, 2009, the total U.S. federal debt was $ 10.71 trillion, or about $37,703 per capita.
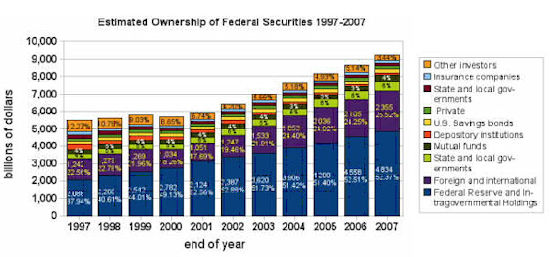
So who is lending the $trillions of dollars?
The chart above shows the Fed, its surrogates, and foreign governments now hold 80% of outstanding federal debts. Let’s examine those giant category holdings.
Foreign Government Holding:
US banks relentlessly provided credit to US consumers (money out of thin air) and the consumers spent well over $1 trillion on Chinese goods since 2001. The Chinese exporters exchanged the dollars with the bank of China, which in turn bought the US treasury.

Fed and Government Holding:
While Mr. Bernanke and Ivory academics calling it “unconventional measures”, The Fed’s direct purchasing of the US Treasury to fund government spending is in fact no different from Zimbabwe’s money printing to pay servants and armies.
Today, only 20% of the US treasury is owned by private enterprises, illustrating the extremely fragile position of US debts, which is the engine of America’s growth.
3) The dollar: In God We Trust

Betting long-term on the dollar is suicidal, timing short-term rebound could be equally hazardous to your health. With the printing press going full force, I wouldn’t for one-second trust my savings in dollars under the influence of American politicians, much less Chinese technocrats!
The bank of China doesn’t believe in God and the trust in the US dollar may prove to be as misguided as Zimbabweans’ trust in their dollar.

For more information on Hyperinflation See:
- What is Hyperinflation? Contains a list of 27 examples of hyperinflation from ancient Egypt through modern day North Korea (2011).
- How Does Gold Fare During Hyperinflation?
- Hyperinflation of Weimar Germany
- Confederate Hyperinflation Rates
- Surviving a Hyperinflation
- Syria in the Throes of Hyperinflation (2013)
- Zimbabwe Hyperinflation and the U.S. Dollar (2009)
- Zimbabwean Hyperinflation Officially Estimated At 2.2 Million Percent (2008)
John Lee, CFA
John Lee is the founder and principal of Mau Capital Management and the portfolio manager of a mining equity hedge fund. He is a CFA charter holder and has degrees in Economics and Engineering from Rice University. Mr. Lee has a keen interest in the history of money and economics and has previously studied under Mr. James Turk, a renowned authority on the gold market.
Since 2001, Mr. Lee has researched hundreds of mining companies and personally met with dozens of management teams. He actively consults and advises resource companies on project acquisitions, strategic marketing, and corporate financing.
