
 Oil Prices 1946-Present
The first table shows the Annual Average Crude Oil Price from 1946 to the present. Prices are adjusted for Inflation to December 2022 prices using the Consumer Price Index (CPI-U) as presented by the Bureau of Labor Statistics.
Note: The first table presents ANNUAL Average prices they will not show the absolute peak price and will differ slightly from the Monthly Averages in our Oil Price Data in Chart Form.
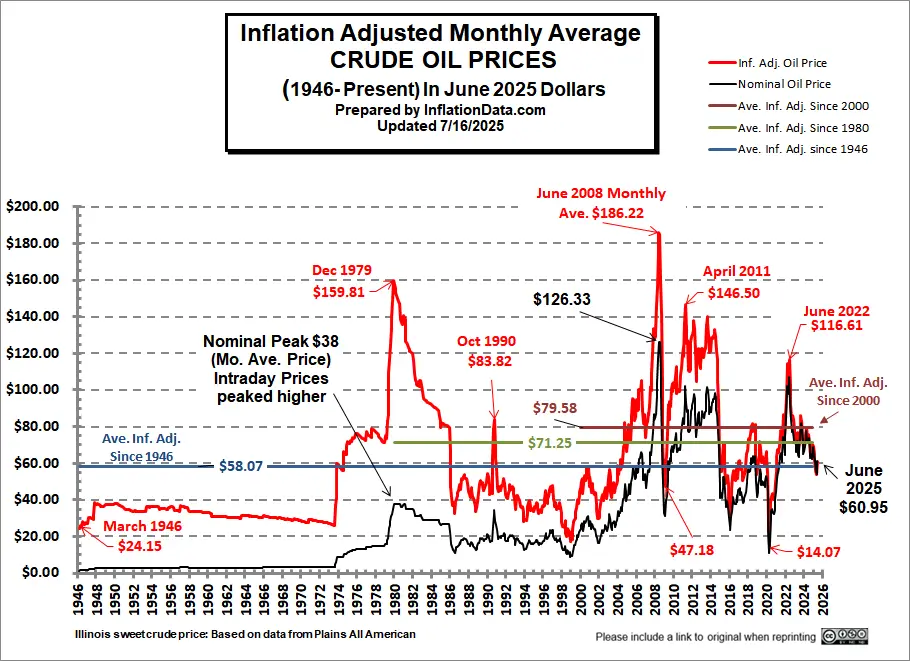
The second table presents the monthly average crude oil prices for Illinois Sweet Crude plus their inflation-adjusted prices.
Inflation-adjusted oil prices reached an all-time low in 1998 (lower than the price in 1946)! And then just ten years later, in June 2008, Oil prices were at an all-time monthly high for crude oil (above the 1979-1980 prices) in real inflation-adjusted terms (although not quite on an annual basis).
Prices are based on historical free market (stripper) oil prices of Illinois Crude as presented by Illinois Oil and Gas Association and Plains All American Oil. Typically Illinois Crude is a couple of dollars cheaper per barrel than West Texas Intermediate (WTI) because it requires a bit more refining.
Price-controlled prices were lower during the 1970s but resulted in artificially created gas lines and shortages and do not reflect the true free market price. Stripper prices were allowed for individual wells under special circumstances (i.e., the wells were at the end of their life cycle), but the oil they produced represented the actual free-market prices of the time.
In June 2025 WTI Crude Averaged $64.42 and Illinois Sweet Averaged $60.95
2025 Crude Oil Prices- Nominal and Inflation Adjusted in June 2025 Dollars
| Jan-25 | Feb-25 | Mar-25 | Apr-25 | May-25 | Jun-25 | |
| Nominal | $68.25 | $64.18 | $61.06 | $55.98 | $53.93 | $60.95 |
| Inf. Adj. | $69.30 | $64.88 | $61.59 | $56.29 | $54.11 | $60.95 |
Strategic Petroleum Reserve
In an effort to fight inflation the Biden administration flooded the market with cheap oil by depleting our strategic petroleum reserves eventually depleting reserves by 47%.
Note: Reserves would have started at much higher levels had Democrats not refused Trump’s request to increase reserves when oil was dirt cheap.
This chart shows the extent of the recent strategic petroleum reserve drawdown compared to those of Desert Storm, various hurricanes, and other supply disruptions, and how much has been replaced.
Unfortunately, the E.I.A. is always a couple of months behind in updating its data. But with the data we have, we can see that the recent draw-down dwarfs all of the others combined. In July 2020, the SPR stood at 656.140 million barrels.
As of June 2023, the SPR was down to 347.158 million or roughly -46% below July 2020 levels, which were already below 2010 levels. From January to February, levels were unchanged, so we were hoping that they had halted the drawdown, but drawdowns continued. By September 2023, there was a slight increase to 351.274 million. And by December 2024 it was 393.568 million. As of April 2025, the SPR was at 399.121 million barrels. (The most recent data available as of this writing).
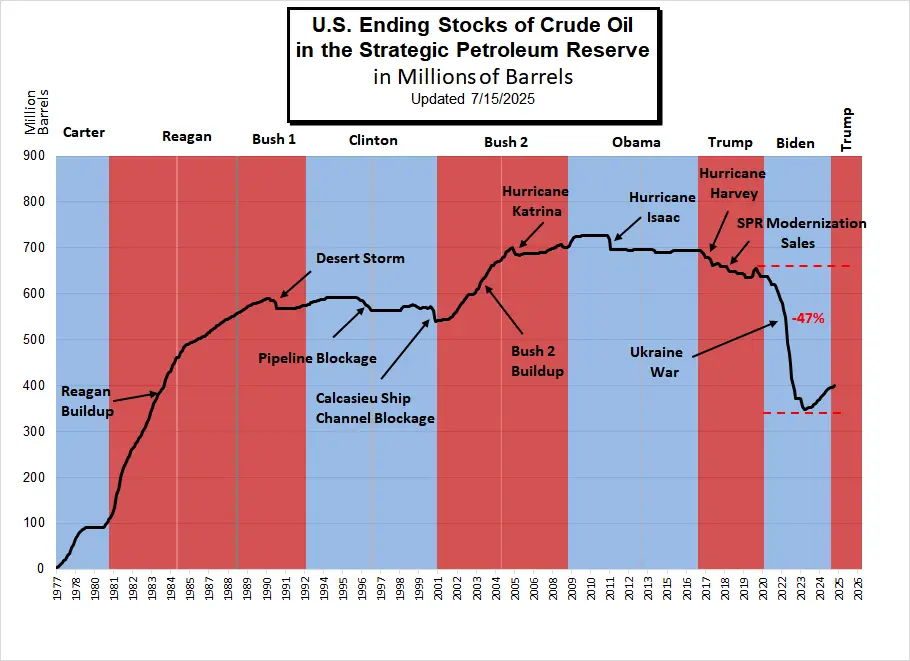
Note: Section 404 of the Bipartisan Budget Act of 2015 authorizes the Secretary of Energy to draw down and sell up to $2 billion of SPR crude oil, for fiscal years (FY) 2017 through 2020, to carry out an SPR modernization program, resulting in the SPR drawdown during the Trump administration despite Trump’s desire to build up the SPR when oil prices were low.
U.S. Ending Stocks of Crude Oil in SPR
(Million Barrels)
| Jan | Feb | Mar | Apr | May | Jun | Jul | Aug | Sep | Oct | Nov | Dec | |
| 2010 | 726.612 | 726.608 | 726.604 | 726.599 | 726.594 | 726.591 | 726.586 | 726.581 | 726.513 | 726.550 | 726.547 | 726.545 |
| 2020 | 634.967 | 634.967 | 634.967 | 637.826 | 648.326 | 656.023 | 656.140 | 647.530 | 642.186 | 638.556 | 638.085 | 638.086 |
| 2021 | 638.085 | 637.773 | 637.774 | 633.428 | 627.585 | 621.304 | 621.302 | 621.302 | 617.768 | 610.646 | 601.467 | 593.682 |
| 2022 | 588.317 | 578.872 | 566.061 | 547.866 | 523.109 | 493.324 | 468.006 | 445.057 | 416.393 | 398.569 | 388.419 | 372.030 |
| 2023 | 371.579 | 371.579 | 371.175 | 363.723 | 354.366 | 347.158 | 347.454 | 350.330 | 351.274 | 351.274 | 351.911 | 354.684 |
| 2024 | 358.013 | 360.958 | 363.934 | 366.917 | 370.167 | 373.072 | 375.433 | 379.656 | 382.930 | 387.218 | 391.800 | 395.064 |
| 2025 |
According to the statutory drawdown rules the Biden drawdown looks illegal. The rules regarding a drawdown of the SPR are:
In no case may the Reserve be drawn down –
(A) in excess of an aggregate of 30,000,000 barrels with respect to each such shortage;
(B) for more than 60 days with respect to each such shortage;
See: EIA Data History of SPR Releases Historical Inflation Adjusted Crude Oil Prices in Chart (graph) Form
Annual Average Domestic Crude Oil Prices
Updated July 15, 2025
| Annual Average Domestic Crude Oil Prices (in $/Barrel) | ||
| 1946-Present | ||
| Year | Nominal Price | Infl. Adj. Price (June 2025) $ |
| 1946 | $1.63 | $26.51 |
| 1947 | $2.16 | $31.16 |
| 1948 | $2.77 | $37.17 |
| 1949 | $2.77 | $37.53 |
| 1950 | $2.77 | $37.14 |
| 1951 | $2.77 | $34.42 |
| 1952 | $2.77 | $33.65 |
| 1953 | $2.92 | $35.13 |
| 1954 | $2.99 | $35.92 |
| 1955 | $2.93 | $35.24 |
| 1956 | $2.94 | $34.92 |
| 1957 | $3.14 | $36.03 |
| 1958 | $3.00 | $33.53 |
| 1959 | $3.00 | $33.20 |
| 1960 | $2.91 | $31.77 |
| 1961 | $2.85 | $30.75 |
| 1962 | $2.85 | $30.39 |
| 1963 | $2.91 | $30.67 |
| 1964 | $3.00 | $31.20 |
| 1965 | $3.01 | $30.80 |
| 1966 | $3.10 | $30.81 |
| 1967 | $3.12 | $30.18 |
| 1968 | $3.18 | $29.45 |
| 1969 | $3.32 | $29.20 |
| 1970 | $3.39 | $28.18 |
| 1971 | $3.60 | $28.68 |
| 1972 | $3.60 | $27.77 |
| 1973 | $4.75 | $34.23 |
| 1974 | $9.35 | $61.07 |
| 1975 | $12.21 | $73.14 |
| 1976 | $13.10 | $74.27 |
| 1977 | $14.40 | $76.60 |
| 1978 | $14.95 | $73.97 |
| 1979 | $25.10 | $110.51 |
| 1980 | $37.42 | $146.66 |
| 1981 | $35.75 | $127.00 |
| 1982 | $31.83 | $106.47 |
| 1983 | $29.08 | $94.21 |
| 1984 | $28.75 | $89.29 |
| 1985 | $26.92 | $80.72 |
| 1986 | $14.44 | $42.48 |
| 1987 | $17.75 | $50.39 |
| 1988 | $14.87 | $40.62 |
| 1989 | $18.33 | $47.68 |
| 1990 | $23.19 | $57.08 |
| 1991 | $20.20 | $47.85 |
| 1992 | $19.25 | $44.25 |
| 1993 | $16.75 | $37.42 |
| 1994 | $15.66 | $34.07 |
| 1995 | $16.75 | $35.46 |
| 1996 | $20.46 | $42.05 |
| 1997 | $18.64 | $37.47 |
| 1998 | $11.91 | $23.58 |
| 1999 | $16.56 | $31.99 |
| 2000 | $27.39 | $51.28 |
| 2001 | $23.00 | $41.92 |
| 2002 | $22.81 | $40.87 |
| 2003 | $27.69 | $48.56 |
| 2004 | $37.66 | $64.26 |
| 2005 | $50.04 | $82.57 |
| 2006 | $58.30 | $93.26 |
| 2007 | $64.20 | $99.69 |
| 2008 | $91.48 | $136.60 |
| 2009 | $53.48 | $80.26 |
| 2010 | $71.21 | $105.33 |
| 2011 | $87.04 | $124.83 |
| 2012 | $86.46 | $121.49 |
| 2013 | $91.17 | $126.23 |
| 2014 | $85.60 | $116.58 |
| 2015 | $41.85 | $56.95 |
| 2016 | $36.34 | $48.78 |
| 2017 | $43.97 | $57.85 |
| 2018 | $57.77 | $74.20 |
| 2019 | $50.01 | $63.09 |
| 2020 | $32.25 | $40.16 |
| 2021 | $ 60.84 | $72.28 |
| 2022 | $ 87.40 | $96.39 |
| 2023 | $ 70.60 | $74.72 |
| 2024 | $ 69.29 | $72.99 |
| 2025 (Partial Yr) | $ 60.73 | $70.63 |
Monthly Prices
| Monthly Average Domestic Crude Oil Prices | ||
| 2011-2025 | ||
| Year | Nominal Price | Inf. Adj. Price (June 2025) |
| Jan-11 | $84.47 | $123.72 |
| Feb-11 | $81.32 | $118.53 |
| Mar-11 | $94.72 | $136.72 |
| Apr-11 | $102.15 | $146.50 |
| May-11 | $92.92 | $132.64 |
| Jun-11 | $87.92 | $125.64 |
| Jul-11 | $88.82 | $126.81 |
| Aug-11 | $77.72 | $110.66 |
| Sep-11 | $77.31 | $109.91 |
| Oct-11 | $78.00 | $111.12 |
| Nov-11 | $88.78 | $126.58 |
| Dec-11 | $90.30 | $129.07 |
| Jan-12 | $91.71 | $130.51 |
| Feb-12 | $94.06 | $133.27 |
| Mar-12 | $98.04 | $137.86 |
| Apr-12 | $95.11 | $133.34 |
| May-12 | $86.20 | $120.99 |
| Jun-12 | $74.33 | $104.48 |
| Jul-12 | $79.65 | $112.14 |
| Aug-12 | $87.13 | $121.99 |
| Sep-12 | $87.89 | $122.51 |
| Oct-12 | $82.54 | $115.10 |
| Nov-12 | $79.67 | $111.63 |
| Dec-12 | $81.23 | $114.11 |
| Jan-13 | $87.65 | $122.78 |
| Feb-13 | $88.40 | $122.82 |
| Mar-13 | $86.23 | $119.49 |
| Apr-13 | $84.83 | $117.68 |
| May-13 | $87.93 | $121.75 |
| Jun-13 | $88.58 | $122.37 |
| Jul-13 | $97.77 | $135.00 |
| Aug-13 | $101.75 | $140.33 |
| Sep-13 | $99.40 | $136.93 |
| Oct-13 | $93.69 | $129.39 |
| Nov-13 | $86.96 | $120.35 |
| Dec-13 | $90.90 | $125.81 |
| Jan-14 | $87.82 | $121.10 |
| Feb-14 | $93.44 | $128.37 |
| Mar-14 | $93.66 | $127.86 |
| Apr-14 | $95.20 | $129.53 |
| May-14 | $94.82 | $128.56 |
| Jun-14 | $98.18 | $132.86 |
| Jul-14 | $95.46 | $129.24 |
| Aug-14 | $89.20 | $120.97 |
| Sep-14 | $86.07 | $116.63 |
| Oct-14 | $77.44 | $105.21 |
| Nov-14 | $68.62 | $93.72 |
| Dec-14 | $47.25 | $64.91 |
| Jan-15 | $40.96 | $56.53 |
| Feb-15 | $43.85 | $60.26 |
| Mar-15 | $40.74 | $55.66 |
| Apr-15 | $47.10 | $64.21 |
| May-15 | $52.45 | $71.14 |
| Jun-15 | $52.74 | $71.29 |
| Jul-15 | $44.43 | $60.05 |
| Aug-15 | $36.17 | $48.96 |
| Sep-15 | $38.41 | $52.07 |
| Oct-15 | $39.40 | $53.43 |
| Nov-15 | $35.73 | $48.55 |
| Dec-15 | $30.27 | $41.29 |
| Jan-16 | $25.27 | $34.40 |
| Feb-16 | $23.58 | $32.07 |
| Mar-16 | $31.08 | $42.10 |
| Apr-16 | $34.01 | $45.85 |
| May-16 | $39.88 | $53.54 |
| Jun-16 | $41.69 | $55.79 |
| Jul-16 | $38.05 | $51.00 |
| Aug-16 | $37.99 | $50.88 |
| Sep-16 | $37.98 | $50.74 |
| Oct-16 | $42.81 | $57.13 |
| Nov-16 | $38.56 | $51.53 |
| Dec-16 | $45.19 | $60.38 |
| Jan-17 | $45.75 | $60.77 |
| Feb-17 | $46.53 | $61.61 |
| Mar-17 | $42.65 | $56.43 |
| Apr-17 | $44.12 | $58.20 |
| May-17 | $41.56 | $54.78 |
| Jun-17 | $38.21 | $50.32 |
| Jul-17 | $39.60 | $52.18 |
| Aug-17 | $41.20 | $54.13 |
| Sep-17 | $42.56 | $55.62 |
| Oct-17 | $44.56 | $58.27 |
| Nov-17 | $49.77 | $65.08 |
| Dec-17 | $51.07 | $66.82 |
| Jan-18 | $56.60 | $73.65 |
| Feb-18 | $55.22 | $71.54 |
| Mar-18 | $55.93 | $72.29 |
| Apr-18 | $59.30 | $76.34 |
| May-18 | $62.87 | $80.61 |
| Jun-18 | $60.25 | $77.12 |
| Jul-18 | $63.90 | $81.78 |
| Aug-18 | $60.78 | $77.76 |
| Sep-18 | $63.07 | $80.59 |
| Oct-18 | $63.69 | $81.24 |
| Nov-18 | $49.83 | $63.78 |
| Dec-18 | $41.81 | $53.68 |
| Jan-19 | $44.56 | $57.10 |
| Feb-19 | $48.05 | $61.32 |
| Mar-19 | $51.06 | $64.79 |
| Apr-19 | $56.76 | $71.64 |
| May-19 | $53.87 | $67.85 |
| Jun-19 | $47.85 | $60.26 |
| Jul-19 | $50.46 | $63.44 |
| Aug-19 | $47.85 | $60.16 |
| Sep-19 | $49.66 | $62.39 |
| Oct-19 | $47.11 | $59.05 |
| Nov-19 | $50.07 | $62.79 |
| Dec-19 | $52.82 | $66.30 |
| Jan-20 | $50.96 | $63.72 |
| Feb-20 | $43.73 | $54.53 |
| Mar-20 | $23.57 | $29.46 |
| Apr-20 | $11.18 | $14.07 |
| May-20 | $17.80 | $22.39 |
| Jun-20 | $31.35 | $39.23 |
| Jul-20 | $33.74 | $42.01 |
| Aug-20 | $35.17 | $43.65 |
| Sep-20 | $32.61 | $40.41 |
| Oct-20 | $32.42 | $40.16 |
| Nov-20 | $34.26 | $42.46 |
| Dec-20 | $40.21 | $49.79 |
| Jan-21 | $44.79 | $55.23 |
| Feb-21 | $52.11 | $63.91 |
| Mar-21 | $55.64 | $67.75 |
| Apr-21 | $54.62 | $65.97 |
| May-21 | $58.04 | $69.55 |
| Jun-21 | $64.39 | $76.44 |
| Jul-21 | $65.80 | $77.74 |
| Aug-21 | $60.69 | $71.56 |
| Sep-21 | $64.37 | $75.69 |
| Oct-21 | $74.12 | $86.44 |
| Nov-21 | $71.07 | $82.48 |
| Dec-21 | $64.47 | $74.59 |
| Jan-22 | $75.66 | $86.81 |
| Feb-22 | $84.70 | $96.30 |
| Mar-22 | $101.92 | $114.35 |
| Apr-22 | $98.34 | $109.72 |
| May-22 | $97.67 | $107.78 |
| Jun-22 | $107.12 | $116.61 |
| Jul-22 | $93.12 | $101.38 |
| Aug-22 | $84.40 | $91.92 |
| Sep-22 | $77.04 | $83.72 |
| Oct-22 | $79.72 | $86.29 |
| Nov-22 | $77.18 | $83.62 |
| Dec-22 | $71.94 | $78.18 |
| Jan-23 | $71.46 | $77.05 |
| Feb-23 | $69.70 | $74.74 |
| Mar-23 | $66.28 | $70.83 |
| Apr-23 | $72.22 | $76.79 |
| May-23 | $64.58 | $68.49 |
| Jun-23 | $63.42 | $67.05 |
| Jul-23 | $68.65 | $72.43 |
| Aug-23 | $74.42 | $78.18 |
| Sep-23 | $82.07 | $86.01 |
| Oct-23 | $78.81 | $82.62 |
| Nov-23 | $70.32 | $73.87 |
| Dec-23 | $65.24 | $68.60 |
| Jan-24 | $66.89 | $69.96 |
| Feb-24 | $69.57 | $72.31 |
| Mar-24 | $73.53 | $75.94 |
| Apr-24 | $77.51 | $79.74 |
| May-24 | $71.55 | $73.49 |
| Jun-24 | $71.76 | $73.67 |
| Jul-24 | $73.62 | $75.50 |
| Aug-24 | $68.36 | $70.05 |
| Sep-24 | $62.58 | $64.02 |
| Oct-24 | $64.86 | $66.28 |
| Nov-24 | $62.46 | $63.86 |
| Dec-24 | $68.79 | $70.31 |
| Jan-25 | $68.25 | $69.30 |
| Feb-25 | $64.18 | $64.88 |
| Mar-25 | $61.06 | $61.59 |
| Apr-25 | $55.98 | $56.29 |
| May-25 | $53.93 | $54.11 |
| Jun-25 | $60.95 | $60.95 |
Data Sources:
See also:
- Price comparison of Oil vs. Gold
- At $1000 is Gold Expensive?
- Historical Inflation Adjusted Crude Oil Prices in Chart (graph) Form
- Inflation Adjusted Gasoline Prices
- Crude Oil and Gold
- Oil, Petrodollars and Gold
- Other Inflation-Adjusted Prices