The Bureau of Labor Statistics released their Consumer Price Index (CPI) for June of 2014 on July 22nd. Based on the rounded numbers this would result in an Annual Inflation Rate of 2.1% the same as last month (May). But here at Inflation Data we look at it to two decimal places and based on that we can see that in May the rate was actually 2.13% and in June it fell ever-so-slightly to 2.07%. Many will say that it isn’t statistically significant and it quite possibly isn’t but it is quite possible that inflation is heading down again. Time will tell.
I find it interesting that both the WSJ and Reuters top articles on inflation today say inflation is “Up” WSJ:Spike in Gas Costs Pushes Up Inflation Gauge and Reuters: Inflation inches up while CBS News is much more accurate in saying: US inflation took a breather in June. This just another reason you have to look at the actual data to get the true picture. Obviously two of these journalists had their mind made up about what they were going to say before the data was even released. Based on the rounded data released by the BLS you can say inflation “took a breather” and unless there is zero monthly inflation and zero annual inflation you can always come up with some excuse to say “Inflation inches up” because that is the nature of inflation it is always inching up. If we have monthly inflation but annual deflation you can say “inflation inches up” and if you annual inflation but monthly deflation you can still say “inflation inches up” but “Spike in Gas costs pushes up inflation gauge”? Where do they get that?
Unadjusted Energy Inflation According to the BLS:
| Annual | Monthly | |
| All Energy | 3.2% | 1.5% |
| Fuel Oil | 4.0% | -1.7% |
| Gasoline | 2.0% | 0.3% |
| Electricity | 4.2% | 5.2% |
| Natural Gas | 5.1% | -1.8% |
Does gasoline look like the major mover driving up prices here? Maybe Electricity… but not gasoline… plus Natural Gas and Oil were both down for the month. For the month Food was up 0.2%, Shelter was up 0.2%, and even Medical services were flat for a change… so on a monthly basis inflation for the month of June 2014 was ever so slightly less than for June of 2013 so the annual inflation rate was virtually the same.
But now lets look at the “Seasonally Adjusted” numbers…
Seasonally Adjusted Energy Inflation According to the BLS:
| Monthly | |
| All Energy | 1.6% |
| Fuel Oil | -1.7% |
| Gasoline | 3.3% |
| Electricity | 0.2% |
| Natural Gas | -2.6% |
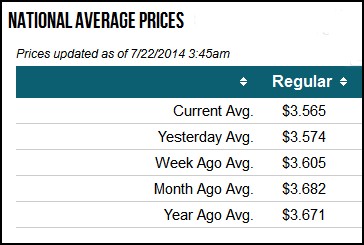
So according to the Seasonally Adjusted numbers gasoline is up dramatically in June. But according to AAA’s “Fuel Gauge Report” gas isn’t up over the year. Here is their data for “Regular” gas.
 If we look at June prices (month ago) we see that on this day in June, gas nationwide averaged $3.68 and a year ago they averaged $3.67! Where is the major increase in the price of gasoline? It’s all in the heads of the “Seasonal Adjusters”.
To be fair, “Year Ago Average” would actually apply to July 2013 (not June) but AAA doesn’t list June prices on their site. In looking back at my data I recorded AAA as saying that on June 18th of 2013 when I recorded the price it was $3.607, which would be an annual increase of 2.08% or virtually identical to the overall 2.07% annual inflation rate for all items. But as we can see, that increase actually occurred in July of 2013 and prices have gone down to $3.21 and then back up to previous levels since.
See Also:
- BLS Consumer Price Release Dates
- Annual Inflation Rate Chart
- Current Inflation Rate
- Historical Oil Prices Table
- Gasoline 20¢ a gallon


Leave a Reply