Summary:
 Lacy Hunt and Van Hoisington launch into their first-quarter “Review and Outlook,” this week with a statement that some may find eye-opening: “The Federal Reserve (Fed) is not, and has not been, ‘printing money’…”
But given the facts of life about how money is really created (and destroyed), they are of course right: it’s all about the acceleration – or deceleration – in the M2 money supply.
Van and Lacy say, “A review of post-war economic history would lead to a logical assumption that the money supply (M2) would respond upward to [the Fed’s] massive infusion of reserves into the banking system.
Mystery Math- Monetary Base up 350%, M2 Up 35%?
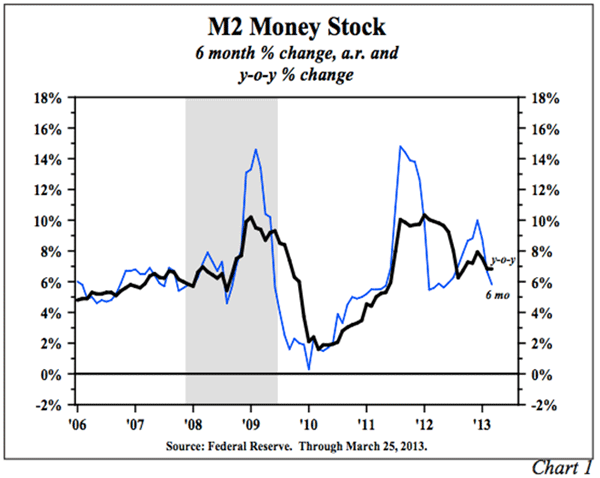
And yet, the Fed’s 3.5x expansion of the monetary base over the past five years has only grown M2 by 35%, and year-over-year growth through March, 2013, was less than 7%. “In other words,” say our authors, “there is no evidence that the massive security purchases by the Fed have resulted in a sustained acceleration in monetary growth; nor is there evidence that economic conditions have improved.”
So what is wrong with this picture?
Well, it turns out that not only can’t the FED control the money supply, it can’t control the velocity of money either. And that means the Fed can’t create rising aggregate demand.
As in, Ben is shooting blanks.
To help us get our heads around this fundamental realization, Van and Lacy lead us deeper into the gooey cytoplasm of Federal Reserve genetics; but the bottom line, as Prof. Irving Fisher taught us, is that GDP = MV. That is, nominal GDP equals money times its turnover (velocity). And don’t look now, but velocity is the lowest it’s been in six decades.
The upshot (downshot?) is that the decade just past saw a growth rate worse than any in US history, except the 1930s. We already knew that, but it’s good to have estimable gentlemen like Messrs. Hunt and Hoisington bring us the numbers and solid analysis to back up the surprising statements we find ourselves forced to make about this oh-so-Muddle Through Economy.
John Mauldin, editor Outside the Box
Like Outside the Box?
Sign up today and get each new issue delivered free to your inbox. It’s your opportunity to get the news John Mauldin thinks matters most to your finances.
Hoisington Investment Management – Quarterly Review and Outlook, First Quarter 2013
Printing Money
“The Federal Reserve is printing money”. No statement could be less truthful. The Federal Reserve (Fed) is not, and has not been, “printing money” as defined as an acceleration in M2 or money supply. Just check the facts. For the first quarter of 2013 the Fed purchased $277.5 billion in securities (net) as their security portfolio expanded from $2.660 trillion to $2.937 trillion. A review of post-war economic history would lead to a logical assumption that the money supply (M2) would respond upward to this massive infusion of reserves into the banking system. The reality is just the opposite. The last week of December, 2012 showed M2 at $10.505 trillion, but at the end of March, 2013 it totaled only $10.450 trillion which was an unexpected decline of $55 billion. Printing money? No.
This broad misconception of the Fed’s ability to print money has been widely embraced since the Fed began its massive balance sheet expansion near the end of 2008. It was then that the Fed expanded the monetary base from $840 billion to $1.7 trillion in a matter of months. Further, from the initiation of this misguided program to the end of March 2013, the Fed has expanded the monetary base from $840 billion to $2.93 trillion. The money supply indeed went up (35%) but not in proportion to the increase in the monetary base (249%). Presently, the year- over- year expansion of M2 is only 6.8%, which is nearly identical to its year-over-year growth rate in March of 2008 before the Fed decided to “help out the economy” (Chart 1). In other words, there is no evidence that the massive security purchases by the Fed have resulted in a sustained acceleration in monetary growth; nor is there evidence that economic conditions have improved.
The Fed’s Flaw
Not only does the Fed not control money, but it cannot determine velocity (V), the speed that money turns over, either. The great American economist, Irving Fisher, identified this connectivity between money and economic growth with a straightforward formula: Nominal GDP equals money (as defined by M2) times its turnover (GDP=MV). Two flaws exist in the belief that the Fed can create rising aggregate demand. First, they do not directly control M2. Second, velocity is almost entirely outside their control. In order to understand how these two variables prevent the Fed from increasing aggregate demand, it is necessary to become conversant with a few terms: monetary base, bank reserves, and money multiplier.
The monetary base, which is derived from a consolidated balance sheet of the Fed and Treasury, has an asset (source side), and a liability (use side). When the Fed purchases government securities, the asset side rises and the liability side, comprised of currency in circulation and bank reserves, increases commensurately. Bank reserves are funds that are held by banks on deposit at the Fed or in their own institution in the form of vault cash. These funds, or reserves, are available for lending. This process of lending reserves creates deposits and currency that constitute the definition of M2.
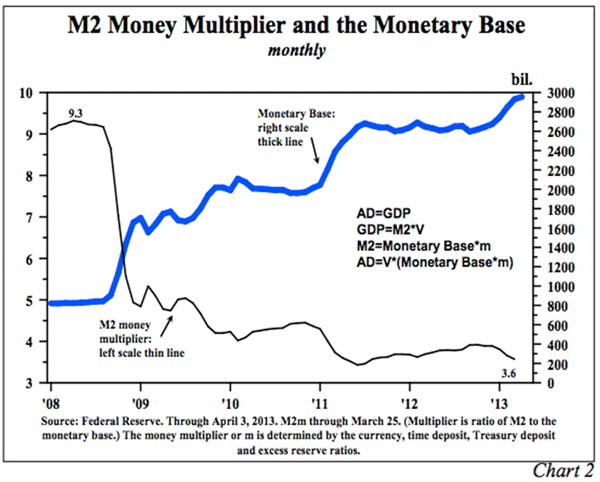
The monetary base is often referred to as “high-powered money” since the reserve component has the potential to expand deposits and therefore money. The operative word is potential, which may or may not be realized. The massive reserve injection since 2008 is therefore the primary reason why there has been an elevated fear of inflation since these funds could be loaned. However, the empirical evidence is clear that high- powered money is not causing an increase in M2. Why? A bank’s conversion of reserves into money is called the money multiplier (Chart 2, left scale). At the end of 2007, the money multiplier was 9.0. That meant that the monetary base of $825 billion (Chart 2, right scale) was multiplied nine times to create the level of M2 that stood at $7.4 trillion. At the end of March, 2013 the monetary base had exploded to $2.9 trillion, but the money multiplier had collapsed to only 3.6, creating an M2 balance of $10.4 trillion. The Central Bank has very little control over the movement of the money multiplier; the actions of the banks and their customers primarily control this variable. This lack of control was evident in the first quarter of 2013 when the monetary base rose by $264 billion and M2 fell because the money multiplier declined from 3.9 to 3.6. Therefore, the Fed’s balance sheet expansion was thwarted.
Velocity
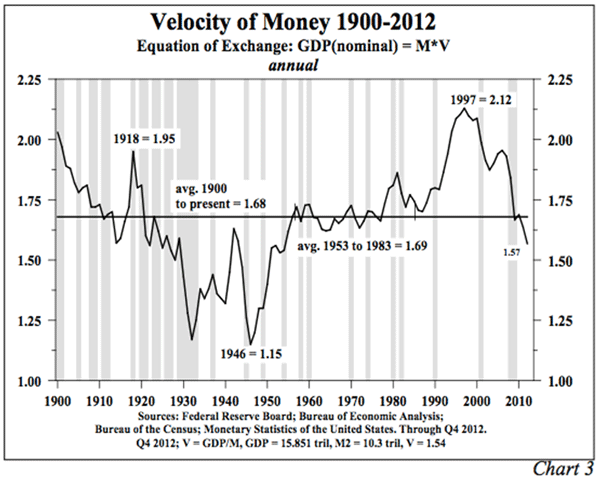
Referring back to Fisher’s equation GDP=MV, the other constraint on the Fed’s ability to increase aggregate demand is velocity. If M2 actually expands, then velocity must remain stable in order for nominal GDP to be lifted in proportion to the rise of M2. While stable velocity was assumed in most of the post war academic work on monetary theory, clear empirical evidence is that velocity is woefully unstable (Chart 3). A host of factors influence velocity, but arguably the most important one is the type of borrowing and lending that occurs. For velocity to rise, any increase in debt needs to create a productive income stream. For the past several years, most of the borrowing and lending activities have related to daily consumptive needs, including borrowing by the federal government as well as much of the recent upturn in consumer lending. Borrowing to finance consumption does not generate a productive income stream nor does it create the resources to repay the borrowed funds. Consequently, velocity has collapsed and now stands at a six decade low.
No Inflation
Inflation cannot ignite in such an environment. Incomes will languish and growth in aggregate demand, as measured by nominal GDP, will slow except for brief, intermittent periods. Some inflationists point to the vast pool of reserves and conclude that if borrowing and lending begin to accelerate, money will surge and so will nominal GDP, but this argument is invalid. First, the money multiplier could continue to contract, just as the most recent figures confirm. Even if, contrary to the latest data, the money multiplier were to stabilize, an extended period would still transpire before any meaningful change in economic conditions. Second, no sign suggests that credit creation is turning more productive. Hence, velocity will continue to fall. Research further indicates that there is a considerable lag between monetary change and altered economic conditions.
In the current setting, those historically long lags should be even longer. The intersection of the aggregate demand curve (AD) with the aggregate supply curve (AS) determines the price level and real GDP. In today’s highly globalized markets, with services coming on-stream from all parts of the world, the AS curve could be in the process of continually shifting outward. Thus, the price level could fall even if there are small outward shifts in the aggregate demand curve. Additionally, the extreme level of indebtedness is a force entirely independent of the Fed, and it is restraining aggregate demand and serving to neutralize what minimal influence the Fed has on the economy. Moreover, this year’s tax hike will serve to shift the aggregate demand curve inward, reducing demand, providing a second powerful counter-force to the Fed’s feeble actions.
Perspective
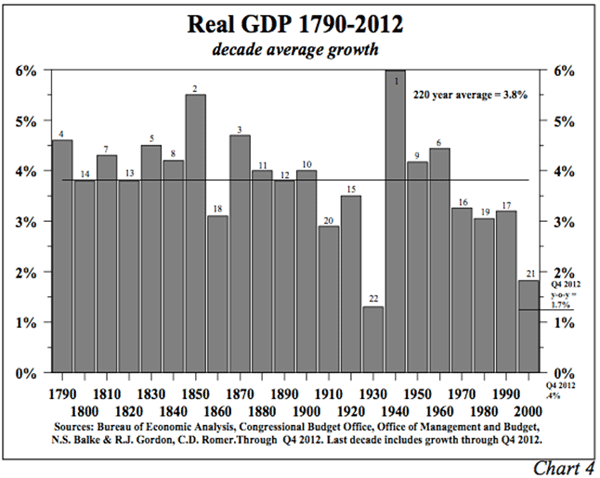
Our present economic situation is nearly unparalleled in American history (Chart 4). An examination of the real economic growth rate of each decade in the United States from 1790 to 2012 reveals the unprecedented sluggishness of our present economic environment. The 1.8% average rise in the thirteen years of this century is less than half of the 3.8% growth rate since 1790. The only decade that witnessed worse economic conditions was, of course, the 1930s.
Debt Constrains Growth
Bad things happen when government debt exceeds 100% of GDP. Four studies published in just the past three years document this conclusion. These studies are highly relevant since OECD figures indicate that gross government debt exceeds 100% in the U.S., Europe, Japan as well as in other OECD member countries. Three of these studies were conducted by foreign scholars and published outside the United States thus avoiding attachment to the unfortunate domestic political debate.
Is Deflation a Continuing Risk?
In their pioneering work, This Time is Different, Carmen Reinhardt and Kenneth Rogoff (R&R) found that “In Depression-era defaults, deflation was the norm.” They, however, observed situations where extreme over indebtedness was followed by high inflation. For all its valuable contributions, R&R’s sample in this best selling 2009 book included both advanced and emerging economies. In later studies other researchers also separated advanced from emerging economies because the latter have options that the former do not. The emerging markets and very small economies in general can resort to currency devaluation when they become over-indebted which creates domestic inflation. Such adversarial action may succeed because the individual countries are too small and insignificant to harm others and thus would not evoke immediate retaliation. But inflation is optional for these smaller countries only. If advanced economies choose currency devaluation (“economic warfare”) to deal with a debt overhang, this evokes retaliation and a “race to the bottom” that is globally deflationary (the 1927 to 1939 experience). As far as we know, all the debt studies of the past three years have confined statistical examination to the data on advanced economies, a procedure that is now widely supported.
Irrationality
Credible academic research indicates that economic growth deteriorates when debt to GDP reaches critical levels – a condition that has now been met in countries that represent 75% of global GDP. When this reality is coupled with the Fed’s inability to create money growth or inflation, the result will invariably be slow nominal GDP growth.
The financial and other markets do not seem to reflect this reality of subdued growth. Stock prices are high, or at least back to levels reached more than a decade ago, and bond yields contain a significant inflationary expectations premium. Stock and commodity prices have risen in concert with the announcement of QE1, QE2 and QE3. Theoretically, as well as from a long-term historical perspective, a mechanical link between an expansion of the Fed’s balance sheet and these markets is lacking. It is possible to conclude, therefore, that psychology typical of irrational market behavior is at play. This suggests that when expectations shift from inflation to deflation, irrational behavior might adjust risk asset prices significantly. Such signs that a shift is beginning can be viewed in the commodity markets. The CRB Commodity Index peaked about two years ago at 691, but now stands at 551, a 20% decline despite massive Fed balance sheet expansion. The ability of the Fed to arrest a downside irrational move in risk assets may be limited. Non-risk assets, such as long dated U.S. treasuries, should benefit from this shift in perception.
Van R. Hoisington
Lacy H. Hunt, Ph.D.
See Also:
- Its Weight in Gold: The Real Prices of Things
- What is Quantitative Easing?
- Why (and How) China is Boosting the Price of Gold
- The Money Multiplier
- Velocity of Money
Recommended by Amazon:
- Money Mischief: Episodes in Monetary History by Milton Friedman
- Why Government Is the Problem (Essays in Public Policy) by Milton Friedman
- Aftershock: Protect Yourself and Profit in the Next Global Financial Meltdown— From the authors who accurately predicted the domino fall of the conjoined real estate, stock, and private debt bubbles that led to the financial crisis of 2008 and 2009, now comes the definitive look at what is still ahead in 2012 and beyond—and what investors can do right now to protect themselves.
- Currency Wars: The Making of the Next Global Crisis
- The New Depression: The Breakdown of the Paper Money Economy


Seriously, this guy is nuts. Anyone paying attention to M2 is nuts. M2 is what? M2 includes a broader set of financial assets held principally by households. M2 consists of M1 plus: (1) savings deposits (which include money market deposit accounts, or MMDAs); (2) small-denomination time deposits (time deposits in amounts of less than $100,000); and (3) balances in retail money market mutual funds (MMMFs). M2 is small money. The dearly departed M3 (not published since March 23, 2006) was the big money (time deposits > $100k). All that Fed printing is going to the big banks and obviously won’t show up in M2. The Fed knew it was wise to stop publishing M3 while it started pumping up it’s balance sheet big time.
It does not take an expert to realize the value of the dollar/purchasing power is weak. The smart thing to do sign up for free creditcard points from the banks and pay entire balance each month to avoid fees, then look into vacation ownership points currency to help protect your discretionary spending over the long term..