Current Annual inflation for the 12 months ending March 2024 is 3.48%
Jump to Current Inflation Table | Jump to Current Inflation Chart
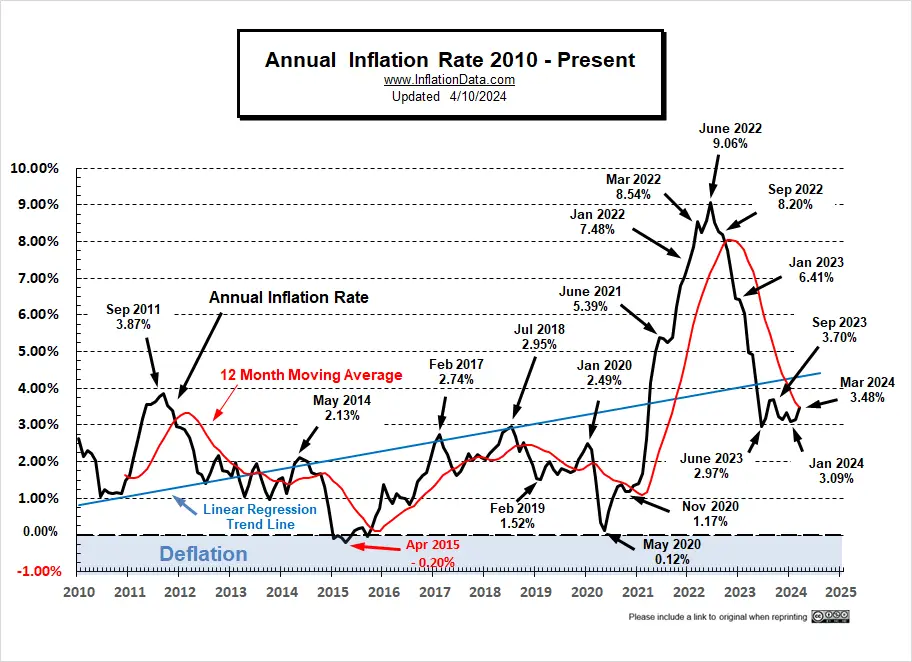
Inflation is down from the June 2022 peak of 9.06%, but even moderate inflation can rapidly erode purchasing power and creates uncertainty as businesses have more difficulty estimating future costs.
Based on the Rule of 72 if inflation is 7.2% it will take roughly 10 years for prices to double. With 3.48% inflation, prices will double in roughly 20.69 years (72 ÷ 3.48= 20.689 years).
Prices doubling in 20 years may not seem so bad, but if you retire at 65 on a fixed income, your standard of living will halve by the time you are 85. And your retirement funds that you set aside at 45 will only buy half as much by the time you reach 65.
Usually, high inflation rates also correspond to high interest rates as lenders need to compensate for the decline in purchasing power of future interest and principal repayments. This results in higher costs of doing business and place an overall drag on the economy. Currently, CDs and Savings accounts are paying more than they have in a long time. If you are lucky if you can get 4.75% interest on your savings which will actually give you a small positive return after inflation. .
In a healthy economy interest rates should exceed the inflation rate.
Does Inflation Increase Economic Output?
The inflation rate plays an important role in determining the health of an economy. Countries with extremely high inflation rates are said to have hyperinflation and when this occurs the economy is often near collapse. See: Hyperinflation in Turkey and Argentina Today
U.S. Annual Inflation Rate in Percent
We calculate the Current Inflation rate (see table below) to two decimal places while the Bureau of Labor Statistics only calculates inflation to one decimal place. Therefore, while being based on the same government Consumer Price index (CPI-U) our data provides a "finer" view.
 March
and April 2023 is a perfect example, according to the
government statistics March=5.0%, and
April=4.9%. However, our data shows inflation
in March as 4.98%, and April as
4.93%. Therefore we can see that there is actually very
little difference between the two months.
March
and April 2023 is a perfect example, according to the
government statistics March=5.0%, and
April=4.9%. However, our data shows inflation
in March as 4.98%, and April as
4.93%. Therefore we can see that there is actually very
little difference between the two months.
In another example we see, according to the government statistics March 2022 =8.5%, May 2022 =8.6%, and July 2022 =8.5%. However, our data shows inflation in March as 8.54%, May as 8.58%, July as 8.52%. Therefore we can see how little change actually occured over this 3 month period.
For a more in depth commentary see Annual Inflation Rate Commentary
Current Annual Inflation Chart
The BLS Commissioner reported:
"The Consumer Price Index for All Urban
Consumers (CPI-U) increased 0.4 percent in March on a
seasonally adjusted basis, the
same increase as in February, the U.S. Bureau of Labor
Statistics reported today. Over the last 12 months, the
all items index increased 3.5 percent before seasonal
adjustment.
The index for shelter rose in March, as did
the index for gasoline. Combined, these two indexes
contributed over half of the
monthly increase in the index for all items. The energy
index rose 1.1 percent over the month. The food index
rose 0.1 percent in March. The food at home index was
unchanged, while the food away from home index rose 0.3
percent over the month."
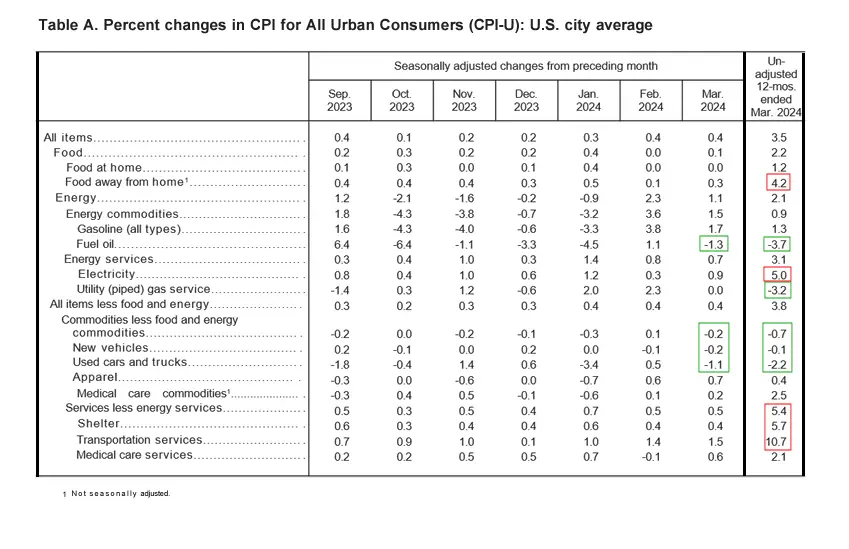
Looking at table A below we can see that on an annual basis energy is still down but on a monthly basis it is up fairly significantly. The biggest gainers on an annual basis were Services like Food away from home, shelter and transportation services.
Seasonally Adjusted Inflation Components Table
The Inflation table below is updated monthly and provides the current Annual US Inflation Rate (not seasonally adjusted) in the right-hand column and the other columns show various monthly components on a Seasonally Adjusted basis. The Inflation rate is calculated using the Current Consumer Price Index (CPI-U) published monthly by the Bureau of Labor Statistics. CPI Index Release Dates
Current Inflation Table
You may also be interested in a table of Monthly Inflation Rate data, which shows how much prices have increased over the previous month. Also check our current articles.
Since high inflation is detrimental to the overall economy but beneficial to the government (since it allows them to pay back their debt with "cheaper dollars") the Federal Reserve has a constant balancing act to try to reconcile the government's desires for higher inflation with the need for a healthy economy.In an effort to convince people that inflation is really good, the government has a constant media circus going promoting the benefits of inflation and decrying the evils of deflation--- but what's so bad about falling prices?
Their major argument revolves around the "stimulating" effects of inflation. Basically it makes people feel richer until they eventually realize that each of their dollars now buys less. But in the meantime they tend to spend the "excess". This results in people buying things they wouldn't have, had they realized that their money was actually worth less than they thought. Eventually this results in a monetary "hangover" as the effects of their buying binge become apparent.
Inflation is largely a result of increases in the money supply months or even years previously. Because of this serious lag in the time between the money creation and the time it shows up in the economy the FED must estimate the impact their money creation efforts will have years in advance. The Federal Reserve tries to target a 2% inflation rate but often over or underestimates the effect their actions will have.
The Federal Reserve monitors the inflation rate for its targeting purposes using the "Core Inflation Rate" which excludes food and energy leading some people to mistakenly believe that the U.S. government doesn't track those items in the inflation rate. Actually the Bureau of labor statistics does track them but the FED simply excludes them for targeting purposes because they are volatile and subject to external forces unrelated to the money supply.
We believe a picture is worth a thousand words, so we track the recent inflation rate in chart form to give you a better sense of the current direction of inflation and also the longer term inflation trends.
The inflation rate is calculated using the Consumer Price Index or CPI.
To calculate inflation from a month and year to a later month and year, Try our Inflation calculator.
We also post the previous Inflation Rates in our Historical Inflation Tables. The Historical Consumer Price Index is also available in table format. You can instantly see the current inflation trend in our chart of the Annual Inflation Rate.
Subscribe to our FREE monthly E-zine and we will keep you up-to-date on what is happening in the area of inflation, interest rates and market trends.
You may also enjoy:
- The misery index is an economic indicator designed to help determine how the average citizen is doing economically.
- Which is Better: High or Low Inflation?
- What's the Difference Between the Consumer Price Index and Inflation?
- What is the velocity of money?
 Connect
with Tim on
Connect
with Tim on
Webmasters- We would be happy to have you use any of our charts... please check our usage policy.
Image courtesy of jscreationzs / FreeDigitalPhotos.net
Use our custom search to find more articles like this

Share Your Thoughts