The Bureau of Labor Statistics (BLS) released their inflation numbers for the year ending September 30th on October 15, 2015. Monthly inflation was negative (disinflationary) for the second month in a row resulting in annual deflation of -0.04%. Although at this level the deflation is so slight that the BLS rounds it to Zero.
So basically prices are on par with those of a year ago. However, that doesn’t mean that all prices are identical to those of a year ago. In the report issued by the BLS yesterday we note that food prices are up 1.4% over a year ago while energy prices are down -18.4%. and all other items excluding food and energy are up 1.9% so we see that the primary cause of the deflation in overall prices is that energy prices are down a lot while everything else is up slightly.
The Consumer Price index for September 2015 was 237.945 compared to 238.031 for September 2014 which resulted in the -0.04% deflation.
Annual Inflation
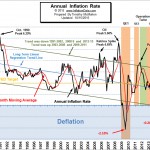
Our Annual Inflation Chart shows the annual inflation rate from 1989. The rate peaked in October 1990 at 6.29% from there it trended down until it bottomed just above 1% in 2002. Inflation increased from there to peak at 5.6%in 2008 just before the crash which took it down to a deflationary -2.10%.
The FED’s Quantitative easing pumped inflation back up to 3.77% by 2011. But Operation Twist and QE3 did not result in additional inflation and instead rates returned to the 1% level.
However, as prices were beginning to climb again in 2014 OPEC decided to drive the price of oil down to flush out shale oil and alternatives like Solar and Wind. This has driven gasoline prices down and resulted in a windfall for consumers as inflation has hovered around zero.
Inflation Projections
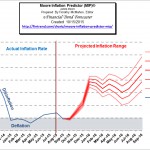 The Moore Inflation Predictor© (MIP) is a highly accurate graphical representation designed to forecast the inflation rate. By watching the turning points, we can profit from inflation hedges (like Gold, Real Estate and Energy Producers) when the inflation rate is trending up and from Bonds when the inflation rate is trending down.
We’ve been projecting the potential for deflation for a while and so far the first five months of 2015 have been exactly that. Although so far it has been very slight at -0.09%, -0.03%, -0.07%, -0.20% and -0.04% for January through May. June through August inflation was near zero and September was negative once again at -0.04% once more. For more information see Inflation Forecast.
Misery Index
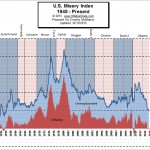 The misery index is an economic indicator designed to help determine how the average citizen is doing economically and it is calculated by simply adding the inflation rate to the unemployment rate. As of October 2015 (based on the most recent official government data for September 2015) is at 4.86% (4.9% unemployment and -0.04% inflation) down from a peak of 12.87% in both October and November 2011.
NYSE Rate of Change (ROC)
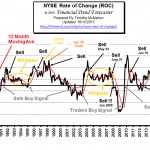 The NYSE has taken a double tumble over the last couple of months but has rebounded a bit. On August 17th the NYSE closed at 10,818 and by August 25th it had fallen to 9,692 for a loss of 10.4% in just over a week. Then it rebounded bouncing between 10,000 and 10,250 before falling to a lower low at 9601.
From there it has begun climbing out of its hole and currently stands at 10,378 very close to the 61.8% Fibonacci retracement. But it isn’t out of the woods yet. There is considerable resistance between 10,500 and 10,750. If it can break above this resistance zone it will have a chance to continue upward.
Over a year and a half ago, in February 2014, the ROC generated a sell signal to get out at around 10,254 so you could have been safely invested in some sort of fixed income investments over that period and not missed any gains.
See the New York Rate of Change chart for more info.
NASDAQ ROC
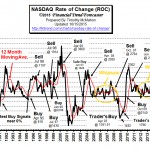 The NASDAQ index rose a mere 0.2% over the previous month but the annual rate of return rose from 6.76% last month to 11.12% this month. This is still a respectable rate of return and considerably better than the NYSE which is currently looking at a year-over-year LOSS of -0.26%. But because the NASDAQ rate of return continues to be below its moving average the NASDAQ ROC continues its SELL signal!
See : NASDAQ Rate of Change for more information.
You might also like:
- Hyperinflation and Government Debt
- Lithium Market Set To Explode – All Eyes Are On Nevada
- The Fed’s Alice In Wonderland Economy – What’s Next?
- Bloodbath in the Oil Patch
- Why Investors Cling to Hope Amid Stock Market Turmoil
- Improving Your Investments with Decision Theory
- OPEC Self-Destruction Thanks To Saudi Oil Strategy?
- Retesting Market Lows Seeking Support
- Why the Japanese Yen’s Bull Run REALLY Ended
- High Paid Miners Now Working at Walmart?
- Six of the Most Dangerous Jobs in America
- September Employment Numbers Disappointing
- Banking Big: Budgeting Tips for Large Families
- Stop Getting Ripped Off: 6 Car Problems You Can Fix Yourself
- Negotiating The Medical Expense Minefield
- What Adopting a Pet Means For Your Finances


The BLS is full of their bull. Food prices are up more than what they claim. Maybe the price of an item may be the same, the container is one-quarter to one-third smaller. So how is that NOT inflation? I can reduce the amount of energy, gas and oil that I use as I don’t eat or drink it. It is hard to cut back on the edible items, fruits, vegetables and other food items. Non food items i.e, toiletries, again may be the same price but the amount you get is a lot less. Maybe you need to go to the grocery store and do the shopping so you can really see the effects of true inflation.
According to the BLS they do take container size into consideration. But as we have said in many places such as:
Is the Government Fudging Unemployment Numbers? and Can We Trust Government Inflation Numbers? When we look at independent numbers like Gallup and MIT’s Billion Price Project the numbers don’t match up.