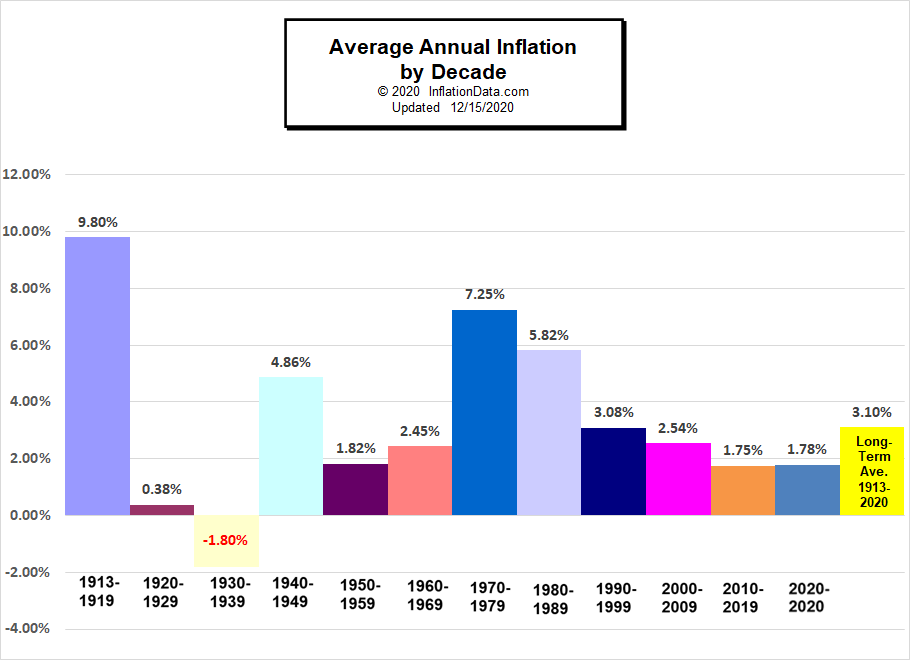
Average Inflation by Decade
We’ve updated the long term inflation charts that appear around the site. These charts include Average Annual Inflation by decade i.e. what the average inflation rate was during the 1990s vs. the 1970s or the 2000s, etc. You can find these charts and more in-depth commentary in the following places:
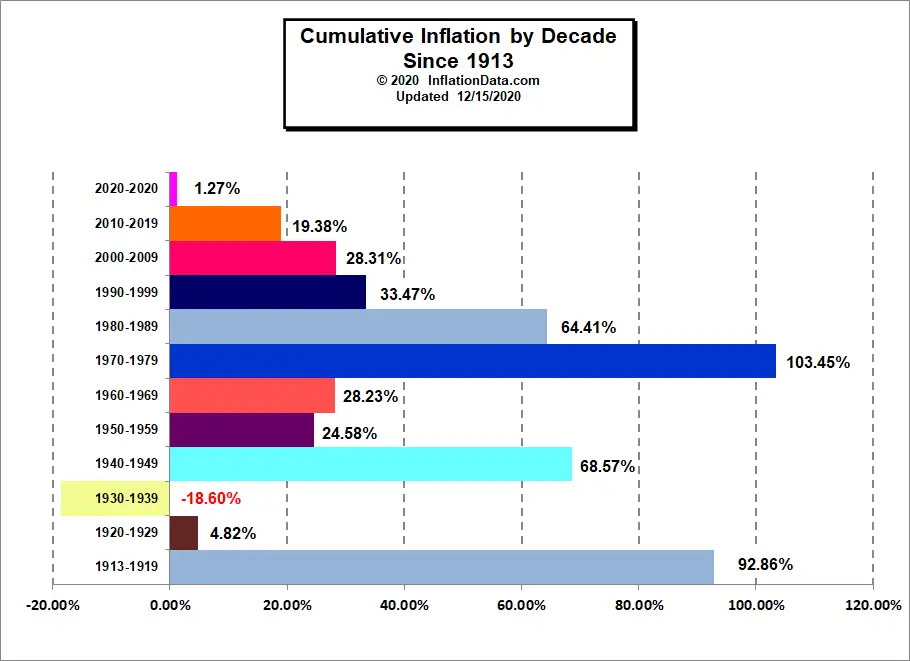
Cumulative Inflation by Decade
This is the amount of inflation experienced during the entire decade combined, of course, 2020 was just 11 months of the new decade. In this chart, it appears that the 1970s were the most inflationary decade followed by the 1910s. But that is a bit misleading since the government didn’t start tracking it until 1913. So had those additional years been added it probably would have topped the 1970s.
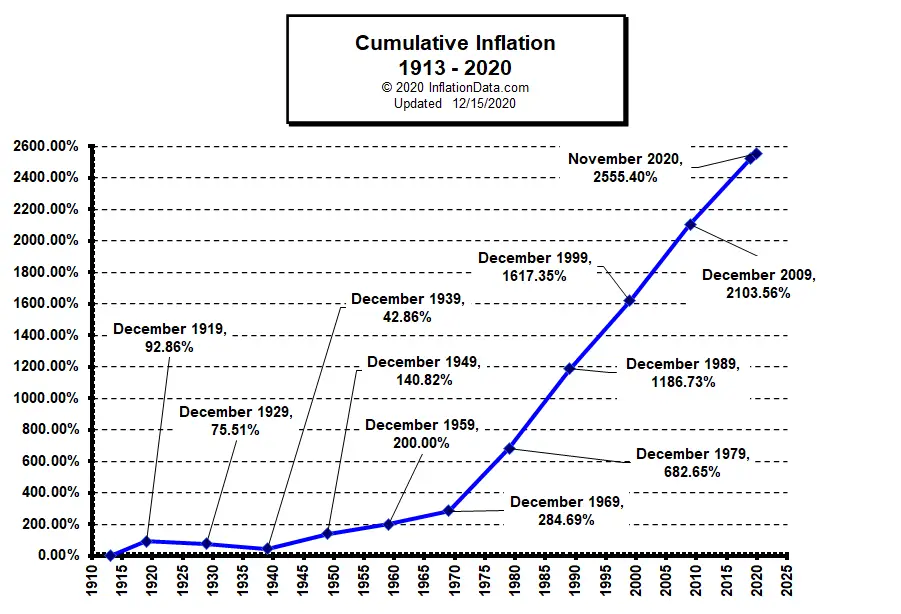
 Cumulative Inflation 1913-2020
Although it looks like inflation started out slow and has exploded since 1970, you have to remember that prices roughly doubled from 1910 through 1920. Then they declined during the 1920s and the Great Depression of the 1930s. Although the early 1920s saw massive deflation for farm commodities, so all the inflation actually occurred during the later 1920s.
Yes, even though the ’20s were wild and crazy and immortalized by F. Scott Fitzgerald’s classic novel, The Great Gatsby not everyone participated in the boom. The vast majority of Americans lived on farms and from 1920 to 1921, the price of wheat, the major crop of mid-west farmers, lost almost half its value. Cotton, the lifeblood of Southern farmers, lost three-quarters of its value. Thus the farms themselves lost 50% of their value since you would have to be crazy to want to buy a farm under those conditions. In addition, the supply of farms for sale increased because farmers were being foreclosed on because they couldn’t pay off the loans they made on those “newfangled” tractors. Although it is possible that those same tractors were the cause of the increase in the production of wheat and thus the fall in the price. A possibly bigger factor was the government, which offered farmers a $2 per bushel price subsidy in an effort to supply Europe with wheat during WWI but when the war ended the subsidy drastically encouraged overproduction.
 Beginning in the 1970s we have seen inflation compound decade after decade without a single deflationary decade (although we have had a couple of deflationary years) but the FED fights them with massive infusions of money printing or more precisely Quantitative easing.
See Also:
- Inflation and Consumer Price Index- Decade Commentary
- Inflation and CPI 1913-1919
- Inflation and CPI 1920-1929
- Inflation and CPI 1930-1939
- Inflation and CPI 1940-1949
- Inflation and CPI 1950-1959
- Inflation and CPI 1960-1969
- Inflation and CPI 1970-1979
- Inflation and CPI 1980-1989


Leave a Reply