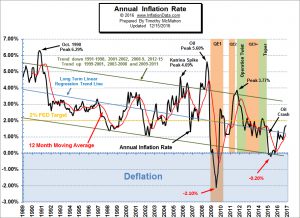
The U.S. Bureau of Labor Statistics (BLS) released the monthly and annual inflation rate data for November 2016 on December 15th. The next data release is scheduled for January 15th. The current annual inflation rate is 1.69% up from 1.64% in October. Monthly inflation was actually negative for November but “less negative” than in 2015 causing the Annual Inflation rate to rise. Inflation for the month of November 2016 was -0.16%, while November 2015 was -0.21%. The CPI index was 241.353 in November 2016 down from 241.729 in October.
Current Annual Inflation Chart
 Annual inflation for the 12 months ending in November 2016 was 1.69% up from a cyclical low of 0.84% in July. August was 1.06%, September rose to 1.46% and October was 1.64%. Although this may look like the beginning of an upward trend it is most likely simply a function of the cyclical rise in inflation during the summer months although monthly infation was slightly higher in October and November 2016 than in 2015.
The annual inflation rate in April, May and June 2016 was 1.13%, 1.02% and 1.01% respectively. Back in January annual inflation was 1.37% and it was 1.02% in February.
See: Current Annual Inflation Commentary for more information.
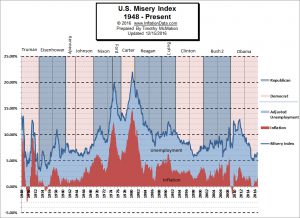
Misery Index
 The misery index as of December 2016 (based on the most recent official government data for the 12 months ending in November) is at 6.29% (4.6% unemployment and 1.69% inflation) down from last month’s 6.46% and well below the peak of 12.87% in both October and November 2011 which was pretty miserable. But it is still above the September 2015 low of 5.06%.
See: The Current Misery Index Chart for more information.
Moore Inflation Predictor (MIP)
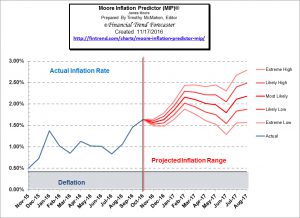
 November’s annual inflation rate was 1.69% up from October’s 1.64% and August’s 1.04%. Our MIP was projecting a flat to down move with a maximum of 1.65%, so at 1.69% we were off by 0.04%. Monthly inflation was -0.16% for November 2016 replacing a -0.21% for November 2015.
This month, the MIP is projecting flat to up move for December followed by an increase over the following months.
See what the MIP is projecting now …
Other Articles You May like:
- India’s Stock Market: Nothing “Random” About It
- Investing in Gold
- Auto Safety Trends
- Trump Rally: False Dawn Or New Bullish Trend?
- Tips for Trading Options with Elliott Waves
- November Unemployment Rates- Economic Confidence Up After Election
- 10 Careers Off the Beaten Path
- 5 Rewarding Careers in Economics to Consider
- 4 More Ways to Pick Up Some Quick Cash
- Home Maintenance: How To Save Money This Winter
- Be Sure Your Family is Secure Physically and Financially
- How to Take Charge of Your Money


I was curious if you have a chart combined with inflation and housing prices?
As well as Inflation combined with Wages? Or maybe all three?
I have tried to find a chart with these figures online and I could probably find the data and chart it myself but it would be nice to get your spin on it as well.
We did an article on Inflation and housing a while back. You can find it here: https://inflationdata.com/articles/inflation-adjusted-prices/inflation-adjusted-housing-prices/