The U.S Bureau of Labor Statistics released their monthly inflation report today covering the 12 months ending in January indicating a massive jump in inflation. Should you worry?
Current inflation (CPI-U) nearly doubled from 0.73% to 1.37%. The Consumer Price Index was 236.916 up from 236.525 in December.
According to the BLS, the rate of decline for Energy has slowed a bit last month. Energy was down -12.6% in January, but only down -6.5% over the previous 12 months in February. Gasoline is only down -7.3% this month compared to -19.7% last month, while Fuel Oil is down -28.7% compared with -31.4% in December. The only energy commodity that is down more than previously is Electricity which is down -2.4% compared with -1.2%. On the other hand motor vehicle insurance is up 5.4%, Hospital services are up 4.6%, and rent is up 3.7%.
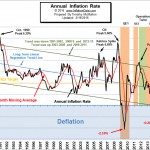 Annual Inflation Chart:

This month’s move has shifted inflation from the bottom of the channel to mid-channel, so the short term trend appears to be up. But remember, unless it moves out of the top of the channel the long term trend could remain down. However, based on timing alone the long term trend has been down since it peaked in 1980. That is just over 35 years. And considering how close to zero inflation is, we may have seen the bottom. For more information see the Annual Inflation Chart.
Inflation Projections (MIP)
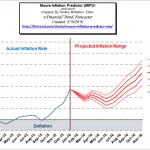 Last month’s Moore Inflation Projection (MIP) was projecting a move up but it undershot the target. But in the commentary I said, “Monthly inflation for January 2015 is also very negative so if they are replaced by less negative numbers that will result in a massive jump in annual inflation… if January 2016 is back to “normal” with roughly 0.50% INFLATION we could see the annual inflation rate jump a full percentage point in one month, which could easily panic the uninitiated.”
So even though monthly inflation was only 0.17% because such a large negative number fell out of the calculation inflation jumped up 0.69% in a single month from 0.73% to 1.37%. Next month a large positive number will be falling out of the calculation so inflation should come back down a bit. See Moore Inflation Predictor for more information.
NYSE Rate of Change (ROC)
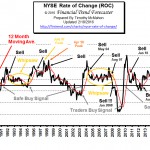 The NYSE is currently around 9532 but a full two years ago (in February 2014), the NYSE- ROC generated a sell signal to get out at around 10,254 so you could have been safely invested in some sort of fixed income investments for almost two years now and not missed any gains. The ROC was down sharply this month and has crossed the zero line (meaning less than zero returns for holding the NYSE for a full year) i.e. those holding market positions are now losing money where if they had gotten out at our sell signal they would not have suffered losses.
NASDAQ Rate of Change (ROC)
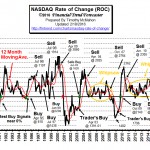 Although the NASDAQ index was slightly higher versus the previous month the annual rate of return fell to a loss for the 12 months -7.27%. This is still considerably better than the NYSE which is currently looking at a year-over-year LOSS of -13.77%. And over -19% down from the peak. The NASDAQ rate of return continues to be below its moving average and the NASDAQ ROC continues its SELL signal! See NASDAQ – ROC for more information.
Misery Index
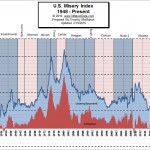
The misery index is calculated by adding the Annual inflation rate to the Seasonally Adjusted unemployment rate and helps us to visualize how good or bad the economy is. Since life gets more “miserable” when both unemployment and inflation rise a high misery index indicates a “bad” economy while a falling index indicates an improving economy. For more information on the Misery index and the Presidents that presided over them see Misery Index.
You may also like:
- The Devaluation Derby– Deflationary forces are building around the world. During 2015 the U.S. saw some annual deflation while some Asian countries saw as much as 10% deflation.
- The Truth About the Russia-Saudi Oil Deal – If you follow the oil news, you’ve probably heard about the OPEC oil deal between Russia and the energy ministers from Saudi Arabia, Qatar, and Venezuela. When the news was announced Oil prices jumped. But if you think this deal actually means anything I’ve got a bridge to sell you.
- Why Hillary was Smiling in New Hampshire – Many commentators were wondering why Hillary was smiling so broadly after the New Hampshire primary since she lost so soundly. NPR said, “Bernie Sanders crushed Hillary Clinton with Democratic voters, just as polls had predicted.” Sanders had 60% of the popular vote and Hillary only had 38%. And there she is smiling like the cat who ate the canary. Why?
- Russia Cries Uncle on Oil – In recent days, signs of a possible breakthrough in the year-long stand-off between Russia and Saudi Arabia on crude production strategy have emerged. Saudi Arabia, OPEC’s dominant member, has long insisted OPEC (read Saudi Arabia) would not reduce output to balance supply and demand absent corresponding cuts from non-OPEC members (read Russia), while Russia has consistently insisted harsh climactic conditions prevent Russian producers from reducing output
- Why Europe is Going to Get a Lot Worse Before It Gets Better –
- Bonds Continue To Flash Warning Signs For Stocks
- How Is The Bullish 1994 Stock Analogy Holding Up?
- How Protective Stops Keep You on the Right Side the Trend
- Tips to Boost Your Credit Score
- Hidden Write-Offs You Shouldn’t Forget in Your Taxes This Year
- Top 10 Cities for 1st Time Home Buyers and Retirees
- How to Get Your Finances in Order Before Moving Internationally
- 6 Things Your Insurance Company isn’t Telling You
- 6 Things to Discuss With Your Financial Adviser before Tax Season


Leave a Reply