
The Fed will meet on the 16th and 17th of September to decide whether it’s time to normalize its accommodative monetary policy. But despite vice-chairman Stanley Fischer’s hints at an inflation increase in September, analysts still think that several factors complicate the FED’s decision.
Recent turbulence in equities markets across the globe as well as uncertainties about China’s market are only some of the factors putting a damper on the economy.
During an Economic Policy Symposium held in Wyoming this August, central bankers discussed how inflation would finally rise despite these issues. After all, the factors that had been holding it down (including fading oil prices, downward price pressure stemming from the dollar and slack in the US labor market) are finally dissipating, Fisher notes.
US Consumer Spending Still on the Rise
Despite the recent global financial market turbulence, the US economy seems to be gaining momentum and consumer spending, which accounts for more than 2/3 of the US economic activity, reflects that momentum. Consumer spending picked up in July, statistics from the Commerce Department show, increasing 0.3 percent after June’s upwardly revised 0.3 percent spending increase.
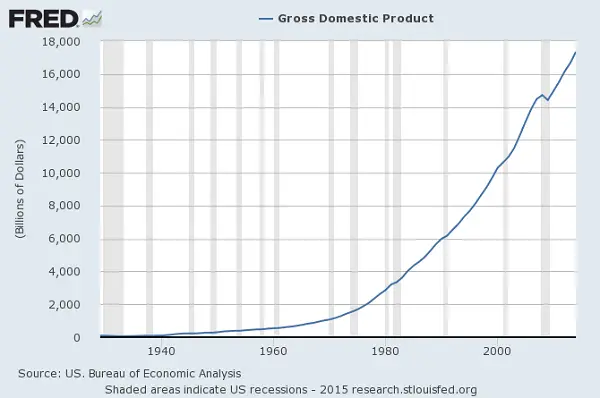
Although the gross domestic product (GDP) has seen a 77% increase since 2000, the question remains why consumers choose to keep spending.
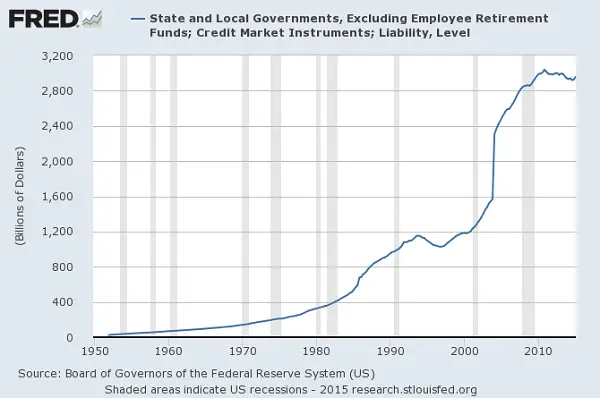
Over the last 15 years, state and local borrowing has almost doubled, one can’t fail to wonder about the impact that this will have on consumers.
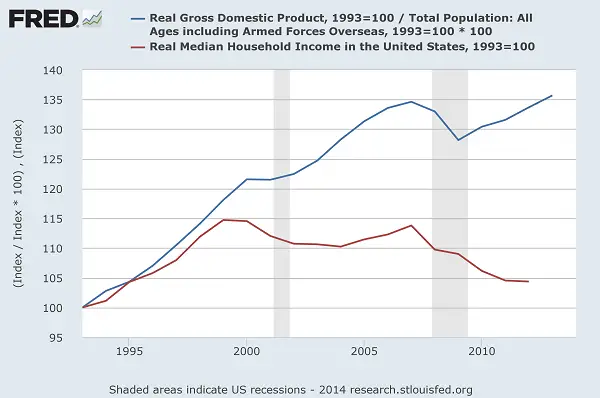
In addition, wages and salaries have barely kept up with inflation. For the past 40 years, real wages (when adjusted for inflation) have remained virtually the same, though a decrease in commodity prices managed to hide some of the impact of this loss of purchasing power.
Since 2000, the real median household income is down 8.5% (from $56,800 to $51,939) while government spending has increased at twice the rate of inflation. Additionally, workers have not participated in the economic growth of the country. Since 1993 Real Gross Domestic Product has grown by 35% while Real Median Household income has only grown by 5%.
Low Price Commodities and their Impact
Though wages have grown a scant 5% after inflation, a deflationary commodity market has recently put a damper on prices. Aside from gasoline, which is the most obvious one, many goods have decreased in price, benefiting consumers and some resource heavy producers but hurting commodity producers, mining companies and oil exploration (including all Oil Producing Countries see: OPEC Self-Destruction Thanks To Saudi Oil Strategy? ).
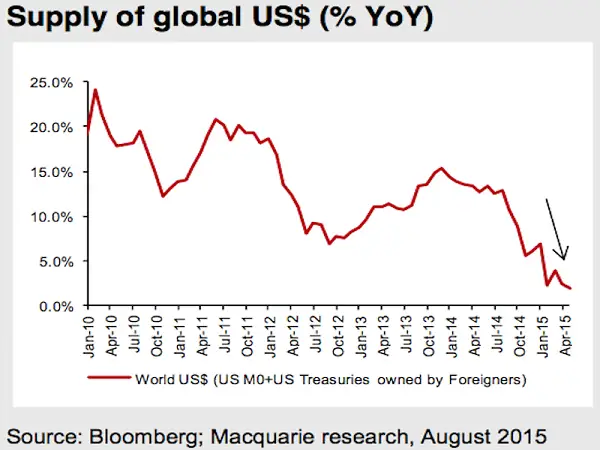
In July, gold, copper, crude oil and aluminum all experienced ugly plunges. Such plunges in price lead to an oversupply in commodities, but an undersupply of the dollar. According to Macquarie analysts, the combination of lower commodity prices and a higher US$ will only lead to an increase in deflationary expectations. With receding inflationary expectations, they expect that the deflationary vortex seen in June 2014 and March 2015 could return.
 Oil and gas prices are the main commodities that consumers use when relating to their economic lives. When their prices go down, they feel as though they have more to spend. On the contrary, when their prices go up (as they are expected to), they will put a downward pressure on consumer spending.
This situation seems to be leading up to a vicious cycle were local and state governments must raise taxes to maintain their spending habits. At the same time, higher taxes will lead to a decrease in household spending, causing an income reduction as well as a sales tax revenue reduction. Ultimately, disposable income and consumption are suppressed and returns are diminished.
Market Volatility and FED Decision
Together, the decline in global equity markets, China’s shaken reputation and the lack of movement towards the two objectives of the FOMC are complicating the FED’s decision of increasing inflation rates. Though the FED has only hinted towards increasing inflation rates, even a small increase could have a major impact especially on small businesses.
Capital expenditures could suffer greatly from an increase, as would production costs. Normally, larger corporations are well equipped to deal with the brunt of inflation, but smaller businesses have to also factor in inflation’s effects on currency exchange rates. Small business owners can always seek business intelligence consultancy to prepare for such events. Ideally, businesses should be proactive in order to ensure that they don’t get blindsided by a bad situation.
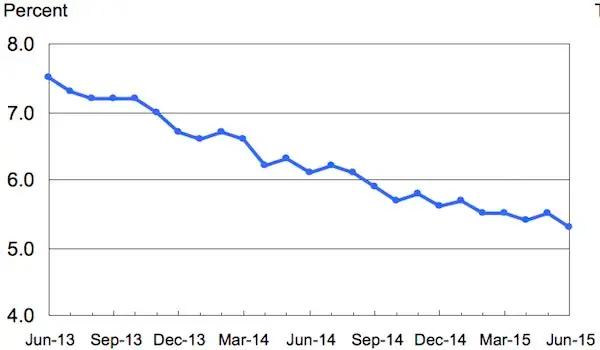
Reports from the G20 meeting have cited the uncertainty over Fed policy as a contributing factor to the volatility of the market. Though the FED may consider the 5.1% unemployment rate consistent with full employment, the IMF cautions against an increase this year. Despite this apparent uncertainty, a survey conducted by the Wall Street Journal in July and August highlighted the conviction of over 80% of the surveyed economists that September will be the moment of the dreaded inflation lift-off.
Unemployment Rate June 2013 – 2015
It’s unlikely that additional data such as the JOLTS report, producer prices, consumer credit or the FED’s Labor Market Index will influence this decision. What will most likely weight greatly, though, is Chinese and European data. China is expected to report inflation figures next week, and these will surely be taken into consideration.
On the one hand, analysts expect China’s Consumer Price Index to increase 0.3%, from 1.6% to 1.9%, suggesting that consumers haven’t experienced deflation. On the other hand, there’s the issue of European equity losses, in part related to the preference of using the Euro as a funding currency, which could cause the Fed to reevaluate its position.
PNC economist Stuart Hoffman is confident that employment reports, together with the unemployment rate and the “healthy payroll gains” will be enough to keep the Fed on track. Certain factors, Hoffman explains, need to remain fairly stable in order to make the September rate hike likely:
- Solid August retail sales
- Solid back-to-school spending
- WTI oil price above the $40 per barrel mark
- Less volatile stock prices
- Dollar/euro above 110
- Dollar/yen below 124
- Dollar/yuan below 6.5
In spite of all these factors, vice-chairman Fischer declined to offer a definitive verdict as to September’s decision. He did note that the Fed’s delay has more to do with the financial market turmoil, seeing that acting in the face of market volatility would prove to be a bad decision. Whether inflationary expectations will be enough to justify a September FED rate hike or poor domestic market conditions will put the hike on hold remains to be seen.

Leave a Reply