
• Home
  • Related Sites
    • Financial Trend Forecaster
      • Moore Inflation Predictor
      • NYSE Rate of Change (ROC)
      • NASDAQ Rate of Change (ROC)
      • Crypto ROC- BTC & ETH
    • Unemployment Data
      • Historical Employment Data
      • Unemployment Rate Chart
      • Labor Force Participation Rate
    • Optio Money
    • Elliott Wave University
    • More Resources
  • Definitions
    • What is Inflation?
    • What is Core Inflation?
    • Inflation vs CPI
    • What is Deflation?
    • What is Disinflation?
    • What is Agflation?
    • What is Stagflation?
    • What is Hyperinflation?
    • What is Quantitative Easing?
    • What is Quantitative Tightening?
    • What is Velocity of Money?
    • What is Fiat Currency?
    • How Do I Calculate Inflation?
    • What are “Sticky Prices” and Why Do They Matter?
  • Featured Content
  • About Us
  • Feedback
    • Sitemap
  • Subscribe Now

InflationData.com

Your Place in Cyber Space for Inflation Data

CPIWidget-July26
  • Numerical Inflation Data
    • Current Inflation Rate
    • Monthly Inflation Rate (Moved)
    • Historical U.S. Inflation Rates
    • Historical CPI
  • Inflation Charts
    • Ann. Inf. Rate Chart
    • Long Term Inflation >
      • Ave. Inf. by Decade
      • Total Inf. by Decade
      • Inflation 1913-1919
      • Inflation 1920-1929
      • Inflation 1930-1939
      • Inflation 1940-1949
      • Inflation 1950-1959
      • Inflation 1960-1969
      • Inflation 1970-1979
    • Cumulative Inflation
    • FED Monetary Policy and Inflation
    • Inflation and Recession
    • Confederate Inflation (1861 – 1865)
    • Misery Index
    • The 3 Stages of Inflation
    • 15-Yr Inflation Trends Chart
  • Inflation Calculators
    • Cumulative Inf. Calc.
    • How Much Would it Cost
    • Historical Inflation Calculator since 1774
    • Salary Inf. Calc.
    • U.K. Inf. Calc.
    • Cost of Gas Calc.
    • Net Worth Calc.
    • Lifetime Earnings Calc.
    • Savings Goal Calc.
    • Financial Calculators
  • Inf. Adjusted Prices
    • Energy >
      • Inflation Adj. Gas Prices
      • Historical Oil Prices Chart
      • Crude Oil Price (Table)
      • Natural Gas Prices
      • Electricity Prices
      • Oil vs Gold
    • Gold >
      • Inflation Adjusted Annual Average Gold Prices
      • Gold is a “Crisis Hedge” not an  “Inflation Hedge”
      • Comparing Oil vs. Gold
    • Corn Prices
    • Education Inflation
    • Housing Prices
    • Mortgage Rates
    • NYSE Index
    • Inf. Indexed Bonds
    • Movie Revenues
    • Inflation-Adjusted Wages
  • Cost of Living
    • Calculate Cost of Living
    • Cost-of-living Adj. (COLA)
    • Consumer Price Index CPI
      • Historical CPI
      • Current CPI
      • CPI Release Dates
    • Gas Prices >
      • Cost of Gas
      • Cost of Gas Per Month
      • Gas vs. Oil Price Chart
    • Food Prices 1913 vs 2013
    • Health Insurance
  • Blog
    • Key Inflation Articles
    • International Inflation
    • Historical Inflation Rates for Japan (1971 to 2014)
You are here: Home » Blog » Inflation » Deflation » What is Biflation?

What is Biflation?

Published on April 4, 2013 Updated on April 1, 2014 by Tim McMahon Leave a Comment

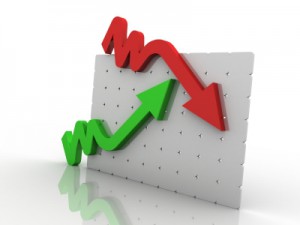
Biflation is a relatively new term coined by Dr. F. Osborne Brown, a Senior Financial Analyst for the Phoenix Investment Group in 2003. It is sometimes referred to as “mixed inflation” but it basically refers to a condition where both inflation and deflation occur at the same time. This seemingly contradictory situation is not a real a paradox but simply appears to be one as a result of faulty logic.

The problem results from thinking that all prices rise in lock-step in times of inflation but this is clearly not the case. It is quite common for electronics to be declining in price (deflation) while oil and gas are increasing in price. Thus we have “mixed inflation” or “biflation” however this is not the primary example of  biflation.
BiflationThe Cause of Biflation

The primary cause of inflation is an over-abundance of money injected into the economy by central banks. Since most essential commodity-based assets (food, energy, clothing) remain in high demand, the price for them rises due to the increased volume of money chasing them. However, in the case of electronics, technology is reducing the costs of production faster than the FED is printing money, thus the price is falling. One of the great gifts of technology is the ability to decrease the cost of living while simultaneously increasing the standard of living. Unfortunately, by printing money the government is appropriating that advantage unto itself, as a form of hidden tax.

Generally, the term biflation applies not to the deflationary effects of technology but rather to the competing forces of necessity vs. luxury items. Thus if incomes are limited, and unemployment is rising, and the price of necessities like gasoline, food and clothing are rising due to monetary inflation that can put downward price pressure on discretionary purchases such as housing and cars while simultaneously prices are rising for necessities.

During the liquidity crisis of 2008, paper assets, began to decline in price first as the derivative market deleveraged and speculators were forced to meet margin calls. This caused downward pressure on all assets while at the same time consumer prices were relatively unaffected as people still needed to eat and drive to work. But as people lost their jobs the downward pressure spread to discretionary spending as people cut back (either due to job loss or potential job loss). As houses were foreclosed on the supply of houses for sale increased and put downward pressure on housing prices. So the downward pressure in prices did not hit the market uniformly but rather rolled through the market affecting different sectors at different times and to different extents. The primary problem people have in understanding biflation is the notion that the economy is homogeneous and that an increase in the money supply will affect all assets equally which is not the case. The printed money flows through the economy starting with the government and then proceeding to government contractors and “entitlement” recipients. Then on to their suppliers etc.

In previous articles like Deflation or Inflation – Which is it? and Deflation or Inflation? Yes. we have touched on how we can see both inflation and deflation at the same time. So we see that even though  inflation is apparent in consumer commodities like gasoline, food and clothing deflation could simultaneously exist in certain sectors such as housing and financial assets like stocks and bonds.

See Also:

  • What is Deflation?
  • Its Weight in Gold: The Real Prices of Things
  • What is Quantitative Easing?
  • What is the Real Definition of Inflation?
  • Disinflation – What is it?
  • What is the Phillips Curve?
  • Misery Index

 Recommended by Amazon:

  • The Age of Deleveraging, Updated Edition: Investment Strategies for a Decade of Slow Growth and Deflation
  • The Debt-Deflation Theory of Great Depressions– The credit crunch today is not destroying capital but recognizing that capital was destroyed by misallocation in the years of irrational exuberance. If that is so, then we are entering a spiral of debt deflation that will play out slowly for years to come. To understand how that works, we turn to Professor Irving Fisher of Yale (1933).
  • Endgame: The End of the Debt Supercycle and How It Changes Everything
  • This Time Is Different: Eight Centuries of Financial Foll

Image courtesy of jscreationzs / FreeDigitalPhotos.net

About Tim McMahon

  • Web
  • |
  • Twitter
  • |
  • Facebook
  • |
  • LinkedIn
  • |
  • More Posts(422)

Filed Under: Deflation, Inflation Tagged With: Biflation, deflation, inflation

Leave a Reply Cancel reply

Your email address will not be published. Required fields are marked *

This site uses Akismet to reduce spam. Learn how your comment data is processed.

Recent Posts

  • June Inflation Down Sharply
  • How Explosive Growth in AI Triggers Inflation
  • Warsh’s First FOMC: No Dot, No Guidance, and No Dovish Pivot
  • May Inflation Up to 4.25%
  • May 2026: BLS April Inflation

Subscribe Now

eTrends Signup Form

A Message from Our Editor

Eliminate Debt

Post Archives

Sponsored:

As a Seasoned Investor I thought I'd seen everything... But recently I discovered TradingView which has really improved the information I have at my fingertips.~ Tim McMahon, editor

TradingView gives me an edge... including powerful charting tools, real-time market data, and a global community of traders—all in one easy to use platform. It has hundreds of indicators, and even custom scripts for more advanced users, and you don't need to change Brokers just use its seamless brokerage integration... TradingView isn't just a charting tool—it's your full trading command center.

Trade smarter. Trade faster. Check Out TradingView for free.

----------

The Best Place to Buy Your Crypto

Coinbase is the largest Crypto Trading platform in the U.S. and the easiest to use. ~Tim McMahon, editor

Check out Coinbase here

Home | Articles | Sitemap | Terms of Service | Privacy | Disclaimer | Advertise With Us

Copyright © 1996-2026 · Capital Professional Services, LLC · Maintained by Design Synergy Studio · Admin

Do Not Sell My Personal Information
