Average Annual Inflation by Decade
Updated December 15, 2020 (Data through November 2020)
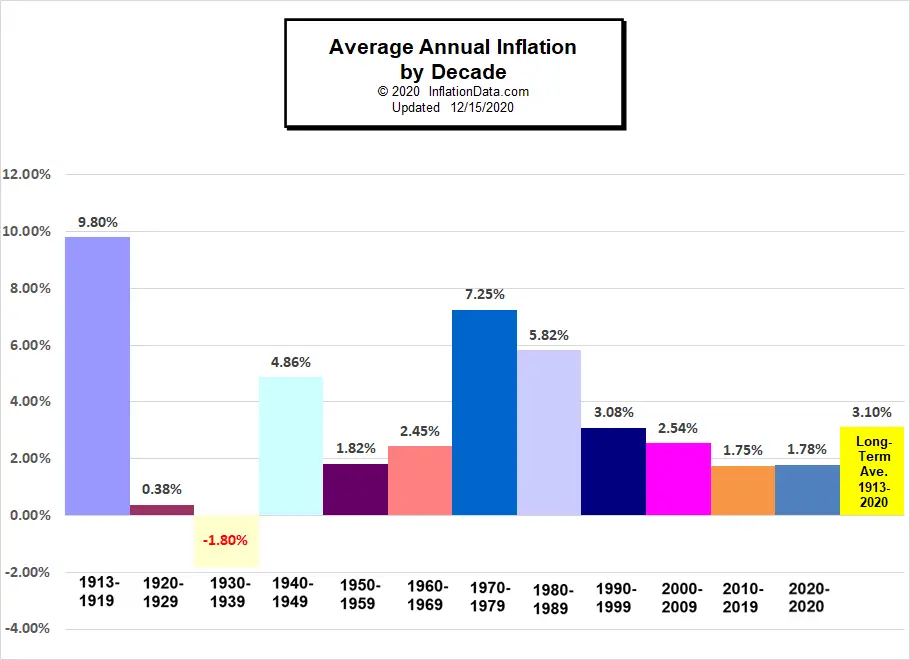
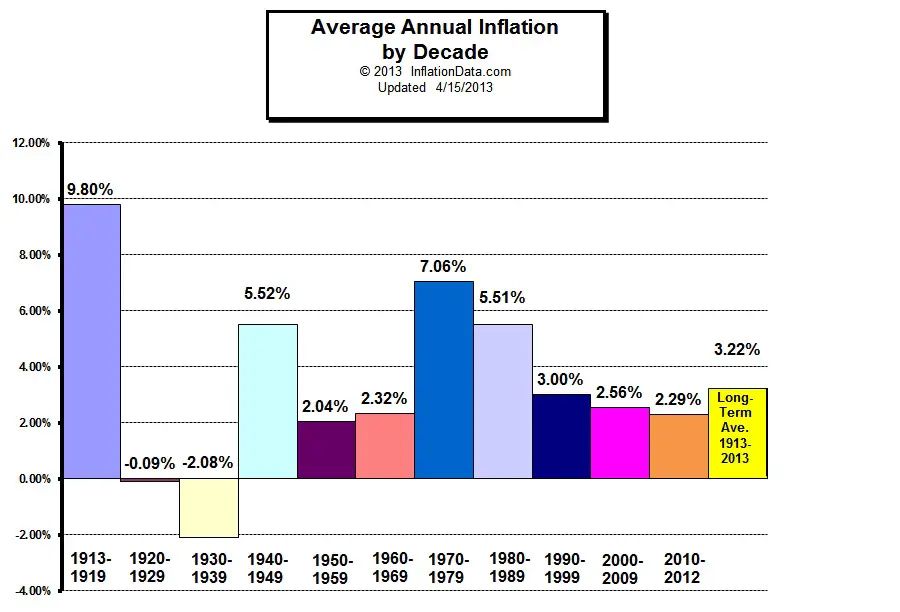
The Chart below shows the Annual Inflation Rates for each decade. Each bar represents the average Annual Inflation for that decade (not the total cumulative inflation for that 10 year period but how much it increased each year on average during that decade). Averages are calculated based on the Geometric Mean. See Average Annual Inflation by Decade for more information.
The final Yellow bar shows the average annual inflation rate since the government began tracking it in 1913.
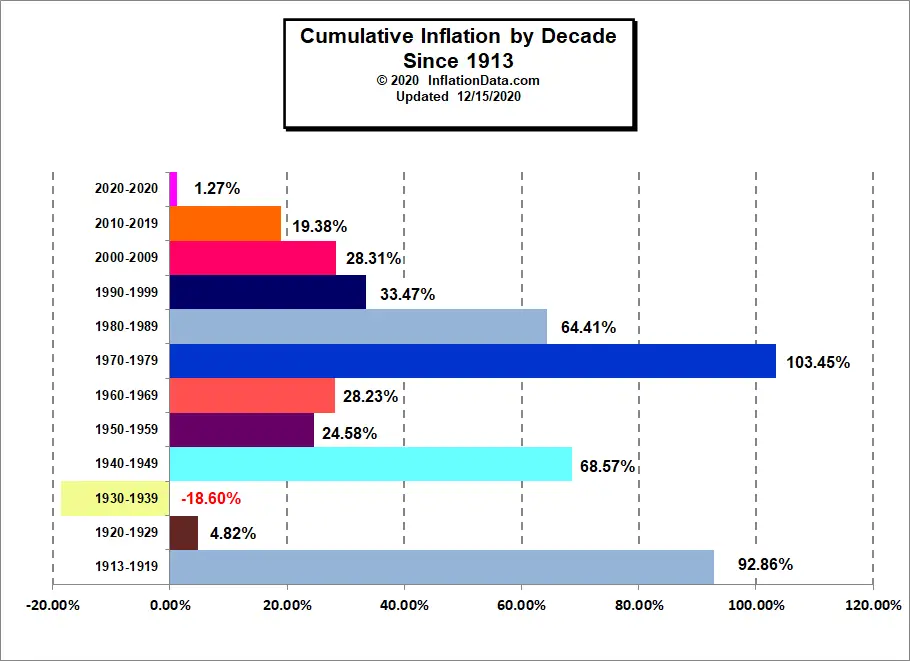
Cumulative Inflation by Decade
If we look at the cumulative inflation for the entire decade we can see that only one decade had prices that ended the decade lower than it started and that was the 1930s. You might expect that this would happen in the 30's because of the great depression. The next closest decade was the "roaring twenties"? Yes, even though the 20's were wild and crazy and immortalized by F. Scott Fitzgerald's classic novel, The Great Gatsby not everyone participated in the boom. The vast majority of Americans lived on farms and from 1920 to 1921, the price of wheat, the major crop of mid-west farmers, lost almost half its value. Cotton, the lifeblood of Southern farmers, lost three-quarters of its value. Thus the farms themselves lost 50% of their value since you would have to be crazy to want to buy a farm under those conditions. In addition, the supply of farms for sale increased because farmers were being foreclosed on because they couldn't pay off the loans they made on those "newfangled" tractors. Although it is possible that those same tractors were the cause of the increase in the production of wheat and thus the fall in the price. A possibly bigger factor was the government, which offered farmers a $2 per bushel price subsidy in an effort to supply Europe with wheat during WWI but when the war ended the subsidy drastically encouraged over production.
As we saw in the first chart the Average annual inflation rate is 3.10%. That doesn't sound too bad until we realize that at that rate prices will double every 20 years.
That means that every two bars on the chart average prices have doubled or about 5 doublings since they began keeping records.
Since, 5 x 2 = 10, you might assume that five doublings would result in prices increased by 10 times, right? i.e. prices are ten times as high as they were in 1913. But that isn't the case! Each doubling is compounded so we actually got
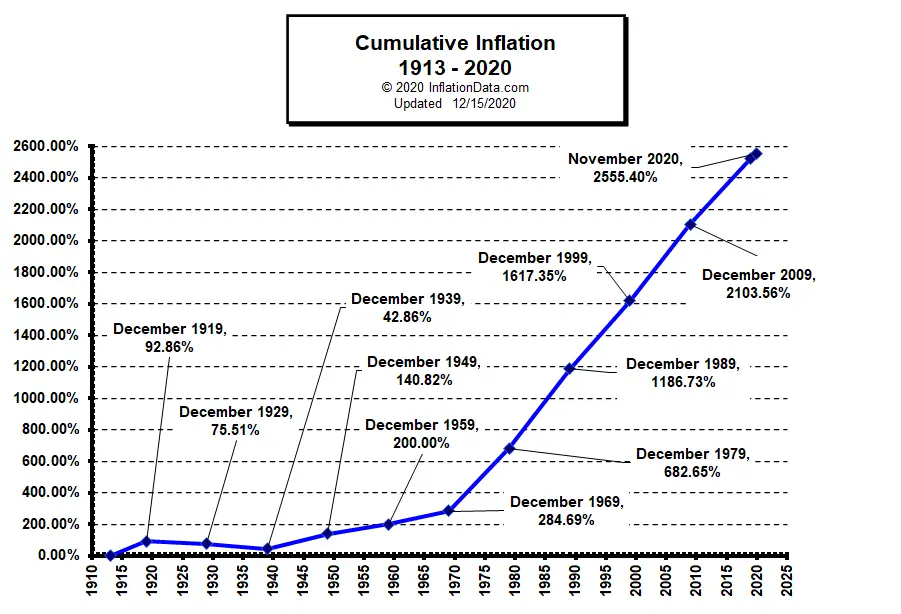
2555% Inflation through November 2020
It isn't just a arithmetic doubling it is a compounding. So just as compound interest can multiply your savings, compound inflation can multiply the effects of inflation. As you can see from the cumulative Inflation chart since 1913 we have seen 2555% inflation.
Yes, that is right Two Thousand Five Hundred Fifty-Five percent inflation.
It is difficult to wrap your mind around 2500% inflation. But that means that prices increased by 2500% or they cost 25 times more.
When inflation is in the single or double digits this concept is easier to follow. For example from January 2005 to January 2006 there was 3.99% inflation. That means that something that cost $100 in January 2005 would cost $103.99 in January 2006.
In other words you add the increase due to inflation to the original amount. So if we have 2555% inflation, something that cost $100 in 1913 would cost $2655 now. (The original $100 + $2555 inflation).
Something that cost $100 in 1913 would cost $2,555 now!
Example prices: The Model T was first produced in 1913 and sold for $575. Ford continued to produce the same model until 1927. By 1927 however through mass production Ford was able to reduce the price of a Model T to $290. In 1927 Ford introduced the Model A which ranged from $385 for a roadster to $570 for the top-of-the-line Fordor. So if you decided to byuy a new Ford in January 2014... You can plug these numbers into our "How Much Would it cost Calculator" : Starting date January 1914, $575 starting price the calculator tells you it is 2502% inflation and you get $14,963.17 as the current price.
In 2020 the MSRP for a Ford Fiesta was $14,260. which is very close to inflation adjusted Model T price but today you would get the bottom of the line rather than the top of the line for that price! But to be fair although the Model T had much more metal than todays cars it didn't get 28 miles to the gallon, have "antilock brakes, 120 hp, stereo sound systems, keyless entry, Air-bags (or even seatbelts), an Automatic Transmission, Air-Conditioning etc. It's possible that even windshield wipers were optional in 1913.
You can plug these numbers yourself into our "How Much Would it cost Calculator" which is on the same page as our Cumulative Inflation Calculator.
So whenever someone mentions 3% inflation as being low... remember compound interest can work for you... but compound inflation can work against you too!
See Also:
- Inflation and Consumer Price Index- Decade Commentary
- Inflation and CPI 1913-1919
- Inflation and CPI 1920-1929
- Inflation and CPI 1930-1939
- Inflation and CPI 1940-1949
- Inflation and CPI 1950-1959
- Inflation and CPI 1960-1969
- Inflation and CPI 1970-1979
- Inflation and CPI 1980-1989
 Connect with Tim on
 Use our custom search to find more articles like this

Share Your Thoughts