
Are Oil Companies Ripping Us Off with Gas Prices?
Recently Crude prices and Gasoline prices at the pump have risen. But on occasion, it seems that the prices travel in opposite directions. Often I will get the question … are gasoline and oil prices really correlated? And the answer may be surprising.
In the chart below we see the correlation between the average annual price of regular gasoline and the average annual price of crude oil. By using the average annual price we eliminate brief spikes and get a better picture of what we really pay over the long term.
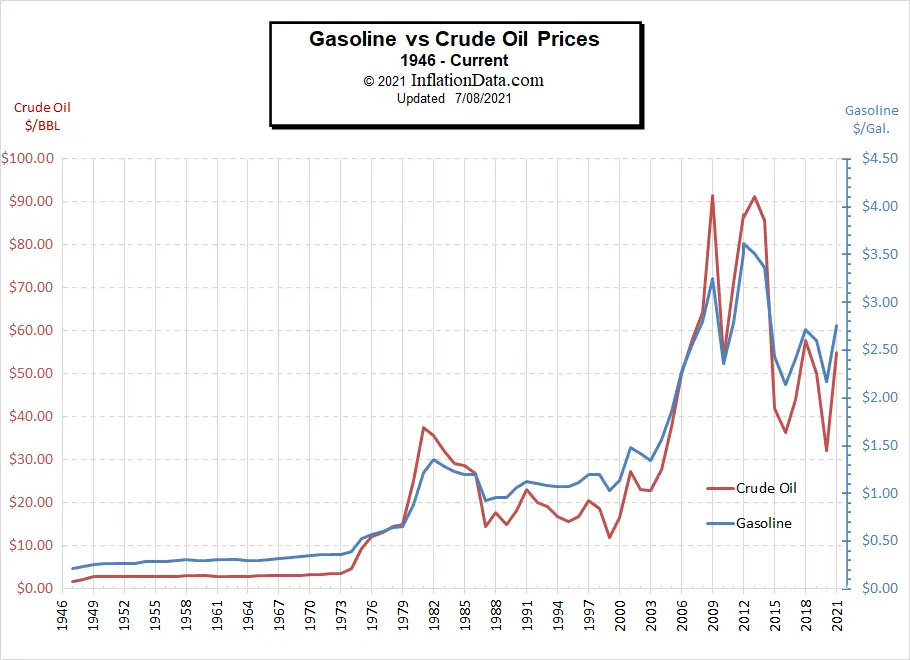
But as we can see from the chart gas and oil prices are fairly closely related. They tend to rise and fall in tandem but at some extremes, oil rose faster while at others gas seems to rise faster. Up until 1972 prices of crude and gasoline tracked very closely (due to government regulation) but since then there has been more divergence. It does appear that Oil prices are a bit more volatile and erratic while gas prices don’t fluctuate quite as much (although they still fluctuate quite a bit). This is partly because the oil companies tend to even out the fluctuations in gasoline prices making more money when oil is cheap and possibly even losing money when oil is expensive. They are primarily concerned with their average profit over the year and don’t want to create too much of an uproar among their customers so they tend to hold prices as steady as possible.
Obviously, the price of crude oil is a major component of the cost of gasoline. But based on this chart it appears that gasoline was a bit more expensive than oil for the period from 1985 through 2003. But during the 2009 and 2012 spikes oil actually spiked higher than gasoline. But we have to be careful that we don’t read too much into this chart because the components are on two different scales, so by adjusting the scale it can make either component vary considerably.
So the next chart we put both gasoline and crude oil on the same scale by measuring the percentage change from the previous year. Since the majority of the volatility occurred since 1970 we began the chart there.
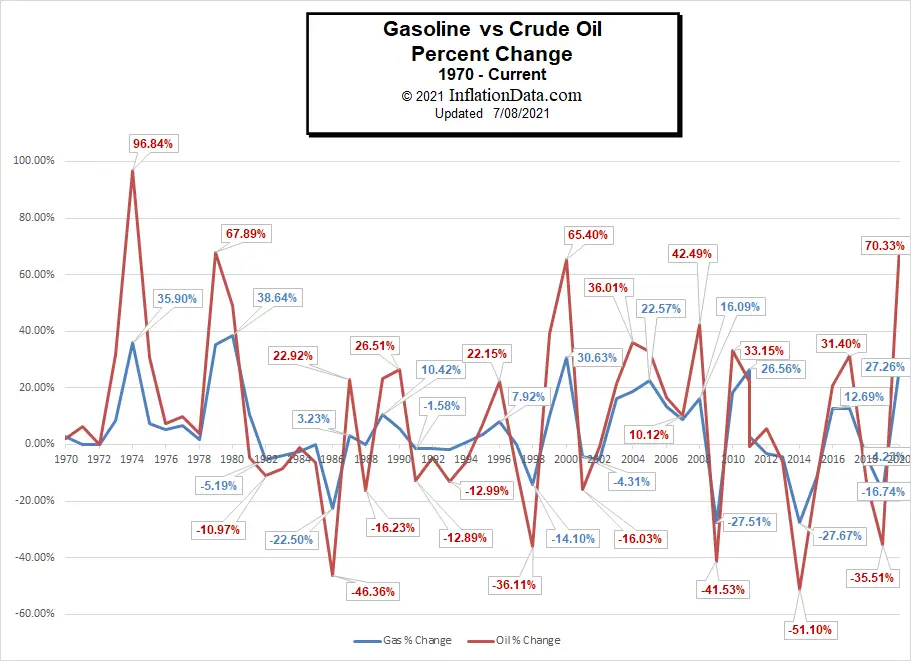
This chart makes it obvious that crude Oil is much more volatile in both directions. For instance, in the first spike crude oil was up almost 97% while gasoline “only” rose 35.9%. The next peak oil (in 1979) was up almost 68% while gasoline was up 35.38% and the following year oil was up another 49% while gas was up 38.64%. So in years like that, the oil companies were losing money, but fear not, they make it up when crude prices fall drastically. For instance in 1986, when crude was down -46.36% gasoline was only down -22.5%. It seems obvious, that in the early 1990s oil companies were trying to make up for losses in the late 1980s as crude prices fell but gas prices stayed pretty steady. Currently, we are in one of the spike periods, where crude is up 70.33% but gas is “only” up 27.26%.
In the following table, we can see average annual Gasoline Prices and Average Annual Crude Oil Prices.
| Average Annual Prices
Regular Gasoline (Gallon) vs. Crude Oil (Barrel) |
||
| Year | Gasoline $/Gallon | Crude Oil $/Barrel |
| 1946 | $0.21 | $1.63 |
| 1947 | $0.23 | $2.16 |
| 1948 | $0.26 | $2.77 |
| 1949 | $0.27 | $2.77 |
| 1950 | $0.27 | $2.77 |
| 1951 | $0.27 | $2.77 |
| 1952 | $0.27 | $2.77 |
| 1953 | $0.29 | $2.92 |
| 1954 | $0.29 | $2.99 |
| 1955 | $0.29 | $2.93 |
| 1956 | $0.30 | $2.94 |
| 1957 | $0.31 | $3.14 |
| 1958 | $0.30 | $3.00 |
| 1959 | $0.30 | $3.00 |
| 1960 | $0.31 | $2.91 |
| 1961 | $0.31 | $2.85 |
| 1962 | $0.31 | $2.85 |
| 1963 | $0.30 | $2.91 |
| 1964 | $0.30 | $3.00 |
| 1965 | $0.31 | $3.01 |
| 1966 | $0.32 | $3.10 |
| 1967 | $0.33 | $3.12 |
| 1968 | $0.34 | $3.18 |
| 1969 | $0.35 | $3.32 |
| 1970 | $0.36 | $3.39 |
| 1971 | $0.36 | $3.60 |
| 1972 | $0.36 | $3.60 |
| 1973 | $0.39 | $4.75 |
| 1974 | $0.53 | $9.35 |
| 1975 | $0.57 | $12.21 |
| 1976 | $0.60 | $13.10 |
| 1977 | $0.64 | $14.40 |
| 1978 | $0.65 | $14.95 |
| 1979 | $0.88 | $25.10 |
| 1980 | $1.22 | $37.42 |
| 1981 | $1.35 | $35.75 |
| 1982 | $1.28 | $31.83 |
| 1983 | $1.23 | $29.08 |
| 1984 | $1.20 | $28.75 |
| 1985 | $1.20 | $26.92 |
| 1986 | $0.93 | $14.44 |
| 1987 | $0.96 | $17.75 |
| 1988 | $0.96 | $14.87 |
| 1989 | $1.06 | $18.33 |
| 1990 | $1.12 | $23.19 |
| 1991 | $1.10 | $20.20 |
| 1992 | $1.09 | $19.25 |
| 1993 | $1.07 | $16.75 |
| 1994 | $1.08 | $15.66 |
| 1995 | $1.11 | $16.75 |
| 1996 | $1.20 | $20.46 |
| 1997 | $1.20 | $18.64 |
| 1998 | $1.03 | $11.91 |
| 1999 | $1.14 | $16.56 |
| 2000 | $1.48 | $27.39 |
| 2001 | $1.42 | $23.00 |
| 2002 | $1.35 | $22.81 |
| 2003 | $1.56 | $27.69 |
| 2004 | $1.85 | $37.66 |
| 2005 | $2.27 | $50.04 |
| 2006 | $2.57 | $58.30 |
| 2007 | $2.80 | $64.20 |
| 2008 | $3.25 | $91.48 |
| 2009 | $2.35 | $53.48 |
| 2010 | $2.78 | $71.21 |
| 2011 | $3.52 | $87.04 |
| 2012 | $3.62 | $86.46 |
| 2013 | $3.51 | $91.17 |
| 2014 | $3.36 | $85.60 |
| 2015 | $2.43 | $41.85 |
| 2016 | $2.14 | $36.34 |
| 2017 | $2.42 | $43.97 |
| 2018 | $2.72 | $57.77 |
| 2019 | $2.60 | $50.01 |
| 2020 | $2.17 | $32.25 |
| 2021 (Partial) | $2.76 | $54.93 |
Sources: Gasoline Prices – US eia.gov Crude Oil Prices – Plains All American
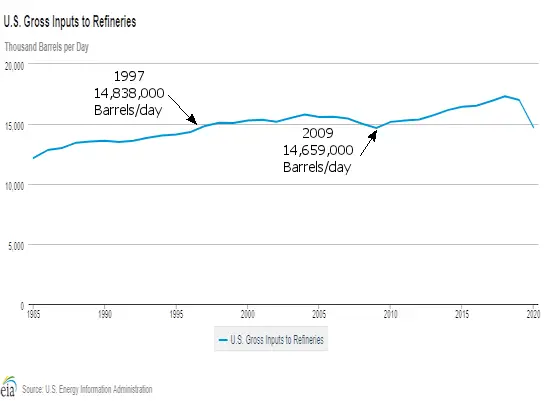
Refinery Production and Capacity
The following chart show refinery production from 1985 through 2020. We can see that production increased by over 2 million barrels per day from 1985 through 1997. But then was relatively flat through 2009. From there production increased by about 3 million barrels per day through 2019. But then due to lack of demand in 2020 production fell drastically. Source US eia.gov.
As of January 1, 2021, there were 129 operable petroleum refineries in the United States. With 5 new refineries coming online since 2014. Prior to that, there were ZERO new refineries that came online between 1998 and 2014 primarily due to environmental concerns. Despite these new refineries, U.S. refining capacity in 2020 still fell 4.5% to 18.13 million barrels per day (BPD) from a record 18.98 million BPD in 2019. The total number of U.S. refineries fell from 141 in 2016 to 129 in 2021 with 5 of those idle. But total capacity remained relatively constant.
- 18,317,036 BPD in 2016
- 18,617,027 BPD in 2017
- 18,598,497 BPD in 2018
- 18,802,435 BPD in 2019
- 18,976,085 BPD in 2020
- 18,127,700 BPD in 2021
Out of a total of 129 refineries, only 17 have been built since 1975, although many have seen capacity increases. But some have also seen capacity decreases.
| The 17 Newest Refineries Currently Operating in the United States | ||||
| Year built | First Operated | Location | Original
Capacity (BPD) |
2021
Capacity (BPD) |
| 2018 | 2019 | Channelview, Texas | 35,000 | 35,000 |
| 2016 | 2017 | Corpus Christi, Texas | 42,500 | 42,500 |
| 2015 | 2015 | Corpus Christi, Texas | 46,250 | 60,000 |
| 2015 | 2015 | Houston, Texas | 25,000 | 25,000 |
| 2014 | 2015 | Galena Park, Texas | 42,000 | 84,000 |
| 1998 | 1998 | Atmore, Alabama | 4,100 | 4,100 |
| 1993 | 1993 | Valdez, Alaska | 26,300 | 55,000 |
| 1991 | 1992 | Ely, Nevada | 7,000 | 2,000 |
| 1986 | 1987 | North Pole, Alaska | 6,700 | 19,700 |
| 1985 | 1986 | Prudhoe Bay, Alaska | 12,000 | 15,000 |
| 1979 | 1980 | Wilmington, California | 5,400 | 6,300 |
| 1978 | 1979 | Vicksburg, Mississippi | 10,000 | 26,500 |
| 1978 | 1979 | North Slope, Alaska | 13,000 | 6,500 |
| 1977 | 1978 | Lake Charles, Louisiana | 6,500 | 135,000 |
| 1976 | 1977 | Garyville, Louisiana | 200,000 | 578,000 |
| 1976 | 1977 | Krotz Springs, Louisiana | 5,000 | 80,000 |
| 1975 | 1975 | Corpus Christi, Texas | 15,000 | 290,000 |
Source: eia.gov
In 2015 Saudi Arabia embarked on a plan to try to drive high-cost alternatives to their oil out of business by driving the price of crude oil down. These high-cost alternatives include Shale Oil and Solar and Windpower. See: Are Low Crude Oil Prices a “Boom Or A Curse” For The World Economy? for more information.
Also See:
- Inflation-Adjusted Commodity Prices:
- Historical Oil Prices Chart
- Annual Average Oil Prices in Table Form
- Comparing Oil vs. Gold
- Which is Over Priced? Oil or Gold?
- Inflation Adjusted Gasoline Prices
- Oil, Petrodollars, and Gold
- Gasoline 20 Cents a Gallon?