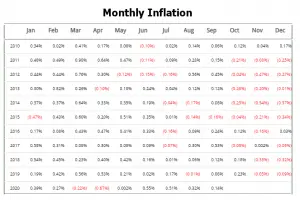
Annual Inflation Increased Very Slightly Annual Inflation rose from 1.31% in August to 1.37% in September. CPI Index rose from 259.918 in August to 260.280 in September. Monthly Inflation for August was 0.32%, for September it was 0.14. The FED holds steady on Assets and FED Funds Rates. Next release November 12th Annual inflation for the 12 months ending in September was 1.37% The CPI index itself was up from 259.918 in August to 260.280. Resulting in a monthly inflation rate of 0.14%. Annual inflation for the 12 months ending in September was up almost imperceptibly from 1.31% to 1.37%. This is a rebound from an astonishingly … [Read more...]
Oil Price Inflation Charts and Tables Updated
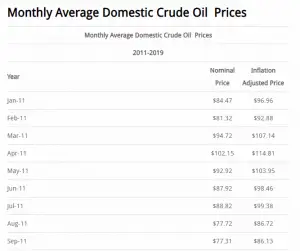
Oil Price Inflation This month we have updated the Crude Oil Inflation Chart which shows historical crude oil prices and also what they would be if you adjusted them for inflation as of February 2019. We have also updated the Annual Crude Oil Prices Table and the Monthly Crude Oil Prices Table both of which also show prices adjusted for inflation. The nominal price of a barrel of oil was only $1.37 back in 1946 but the inflation adjusted price of oil was $18.92 per barrel. (The nominal price is the price you would have actually paid at the time). The major peaks occurred in December 1979, October 1990, and June 2008 at $125.23, $65.68, and $145.93 respectively (all inflation adjusted to … [Read more...]


