Federal Reserve Chairman Jerome Powell delivered his semiannual Monetary Policy Report to Congress on June 24th and to the Senate Banking Committee on June 25th.
Powell noted that U.S. real GDP expanded roughly 2.5% over the past year, supported by resilient consumer spending and a still-solid labor market. Payroll growth averaged about 124,000 jobs per month in the first five months of 2025—slower than the pace seen during the post-pandemic boom but still consistent with a gradually cooling economy.
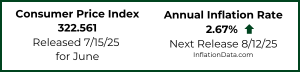
Inflation, however, remains somewhat above target. The Fed’s preferred gauge, core PCE inflation, is running near 2.6%, with overall personal consumption expenditures (PCE) around 2.3%, reflecting modest progress toward the Fed’s 2% goal. Powell attributed some persistence in price pressures to housing and services categories, though he also flagged a new wildcard: tariffs.
Tariffs: One-Time Shock or Sustained Inflation Risk?
A dominant theme in Powell’s testimony was the uncertain impact of recently implemented tariffs on Chinese and Mexican imports. Powell acknowledged that such tariffs could represent a “one-time level adjustment” in prices if firms simply pass through costs without igniting broader wage-price dynamics. However, he cautioned that there is a material risk that tariffs could entrench inflation expectations, delaying progress toward stable prices.
“If it comes in quickly and it is over and done, then yes, very likely it is a one-time thing. But it is a risk we feel we need to manage,” Powell told lawmakers.
The Fed expects initial evidence of tariff pass-through in June and July inflation prints, data that could heavily influence the September FOMC decision.
Rate Cut Outlook: No Rush, But Still on the Table
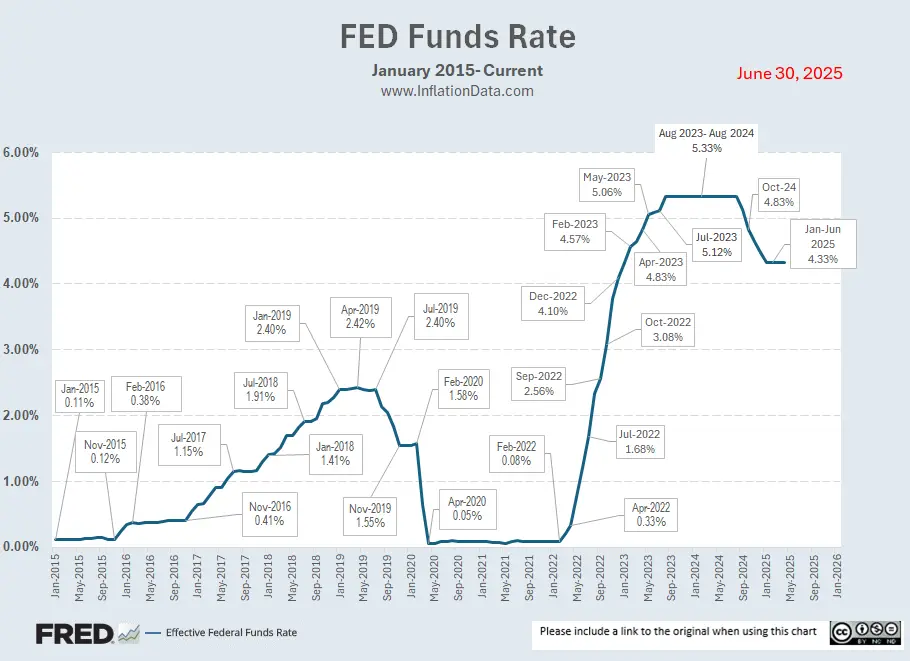
Despite speculation among market participants, Powell dismissed the notion of an imminent rate cut, explicitly saying he does not expect to move at the July meeting. The federal funds rate remains in the 4.25–4.50% range, considered restrictive by historical standards.
Nevertheless, the Fed’s updated dot plot still implies two quarter-point cuts by year-end, contingent on inflation easing in line with forecasts. Powell reiterated that decisions will remain “meeting by meeting”, guided by incoming data on inflation, labor market slack, and global developments.
“We’ll be learning. We will get an inflation number for June. We’ll learn something. Then we’ll get it for July. That will matter for policy,” Powell explained, underscoring the Fed’s incremental, evidence-driven approach.
What is the Fed’s dot plot?
The Fed’s dot plot is a quarterly chart that reveals where each member of the Federal Reserve’s policymaking committee estimates interest rates are headed in the next few years. Each dot represents one individual forecast by a voting member of the Federal Reserve’s policy committee (the FOMC) for where they think the federal funds rate should be at the end of a specific year. Each policymaker plots their best guess (or judgment) for rates at the end of this year, next year, the year after that, and over the “longer run.” It’s anonymous — the chart doesn’t show whose dot is whose — but together the dots paint a clear picture of how aggressively (or cautiously) the Fed expects to raise or cut rates in the future. Why does this matter? Because the Fed controls the federal funds rate, the benchmark rate that dictates the cost of borrowing across the economy, including everything from corporate loans to credit card and mortgage rates.
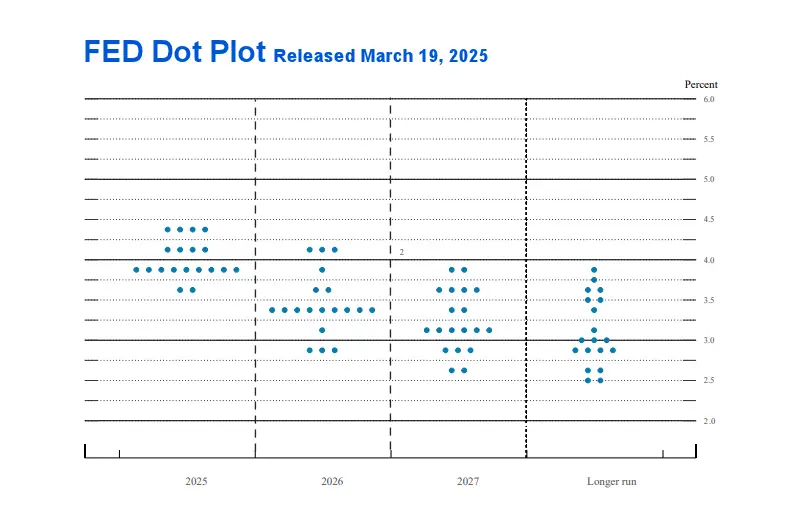
From the above chart, we can see that only four FED governors believe that the proper FED Funds Rate for 2025 is between 4.25% and 4.5%, (i.e., where it currently is) while the majority of governors (9) believe the correct rate is between 3.75% and 4%. And all except those 4, agree that the rate should be lower than the current 4.3% rate.
And for 2026, all agree that the rate should be lower. Looking at this data, most pundits are estimating two rate cuts later this year.
FED Funds Rate
The Fed Funds Rate is the Fed’s main weapon to hit its so-called “dual mandate”: keeping unemployment low and inflation in check. When inflation is high, the Fed jacks up rates to slam the brakes on the economy, even if it means people lose jobs. When growth stalls, it slashes rates to flood the system with cheap money, risking higher inflation down the line. It’s a high-stakes balancing act, and the dot plot gives a rare glimpse into how aggressive or cautious each Fed governor expects to be.
You might also like:
- What Is the Trimmed Mean CPI and What Is It Good For?
- May 2025 Inflation Up Slightly
- The Truth About Why Gold Is Surging
- FED Monetary Policy
- How Do Trump’s Tariffs Compare to the 1930 Smoot-Hawley Tariffs?

Leave a Reply