
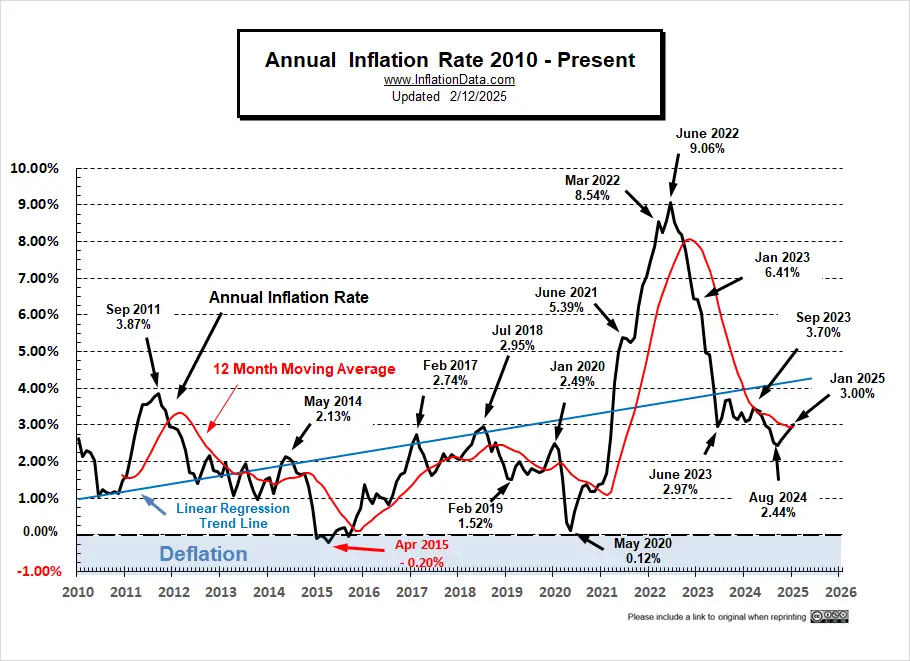
The U.S. Bureau of Labor Statistics released its January 2025 Inflation report on Wednesday February 12th 2025, showing Annual Inflation was up from 2.9% in December to 3.0% in January.
This looks like a 0.1% increase. (But since we calculate it to two digits, it was 2.89% in December and 3.00% in January, which means the actual increase was 0.11%.)
On a non-seasonally adjusted basis, monthly inflation was 0.04% in December and a whopping 0.65% in January 2025 this was up from 0.54% in January 2024.
Inflation Prediction:
As you can see from our MIP projection from last month, January’s Annual inflation at 3.00% is just above our predicted Extreme High.
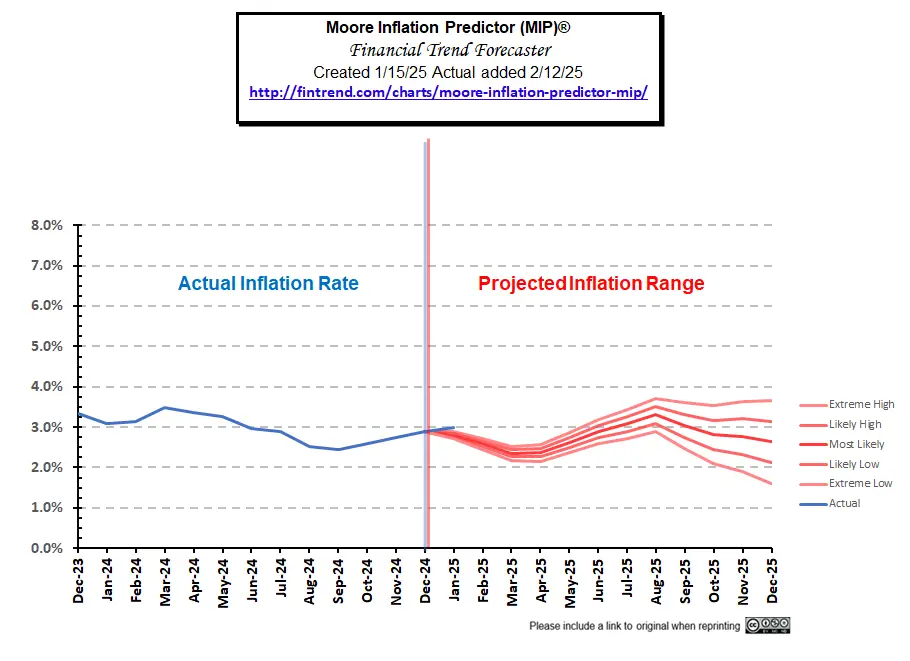
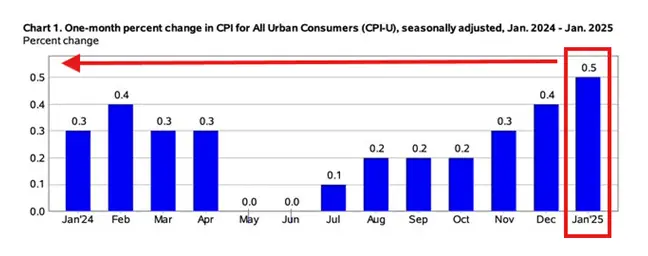
With consensus projections of 2.9% the market is in a bit of a tizzy. Looking at the Seasonally Adjusted 1-month percent change we can see that it is higher than the January 2024 rate. But it is still lower than the unadjusted rate of 0.65%.
 This has reduced the market’s expectations for FED rate cuts down to a single one in 2025 and that isn’t until the 4th quarter. Just a month ago, the market was expecting two rate cuts in 2025.
See this month’s MIP prediction
Annual Inflation… 3.00% in January 2025
- Annual Inflation rose from 2.89% to 3.00%
- The CPI Index rose from 315.605 to 317.671
- Monthly Inflation for December was 0.04% and January 2025 was vastly higher at 0.65%
- Monthly Inflation in January 2024 was lower at 0.54%
- Next release March 12th 2025
| Jan | Feb | Mar | Apr | May | June | July | Aug | Sep | Oct | Nov | Dec | |
| 2025 | 3.00% | NA | NA | NA | NA | NA | NA | NA | NA | NA | NA | NA |
| 2024 | 3.09% | 3.15% | 3.48% | 3.36% | 3.27% | 2.97% | 2.89% | 2.53% | 2.44% | 2.60% | 2.75% | 2.89% |
| 2023 | 6.41% | 6.04% | 4.98% | 4.93% | 4.05% | 2.97% | 3.18% | 3.67% | 3.70% | 3.24% | 3.14% | 3.35% |
BLS Commentary:
The BLS Commissioner reported:
The Consumer Price Index for All Urban Consumers (CPI-U) increased 0.5 percent on a seasonally adjusted basis in January, after rising 0.4 percent in December, the U.S. Bureau of Labor Statistics reported today. Over the last 12 months, the all items index increased 3.0 percent before seasonal adjustment.
The index for shelter rose 0.4 percent in January, accounting for nearly 30 percent of the monthly all items increase. The energy index rose 1.1 percent over the month, as the gasoline index increased 1.8 percent. The index for food also increased in January, rising 0.4 percent as the index for food at home rose 0.5 percent and the index for food away from home increased 0.2 percent…
The all items index rose 3.0 percent for the 12 months ending January, after rising 2.9 percent over the 12 months ending December. The all items less food and energy index rose 3.3 percent over the last 12 months. The energy index increased 1.0 percent for the 12 months ending January. The food index increased 2.5 percent over the last year.
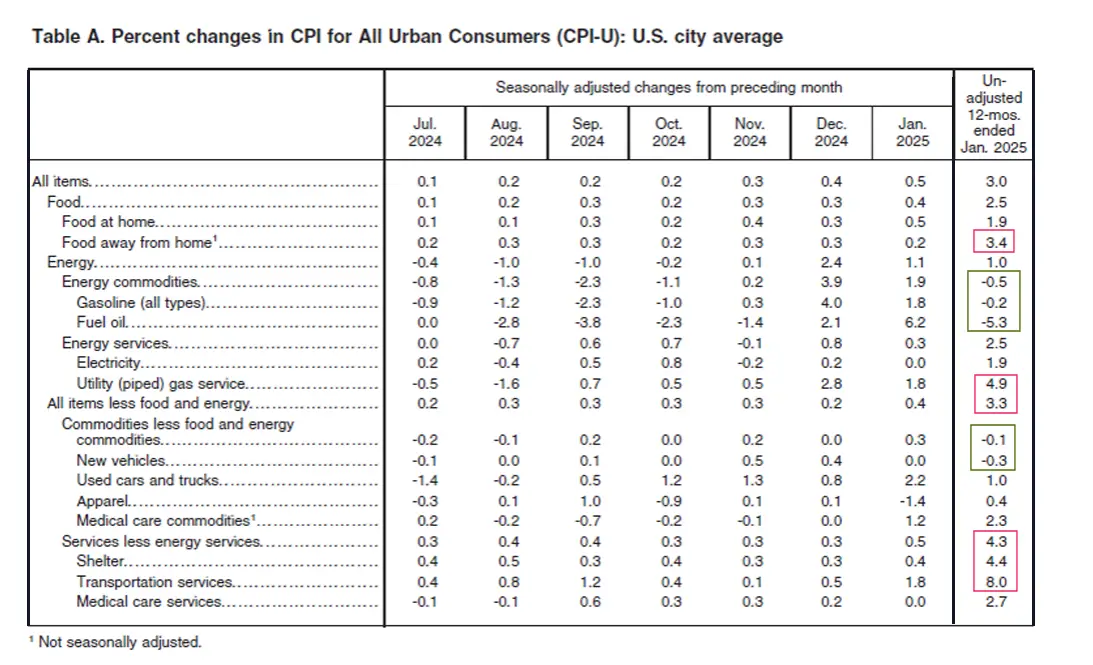
Looking at table A below we can see that on an annual basis energy is still down but on a monthly basis it is up fairly significantly.
The biggest gainers on an annual basis were Services like Food away from home, shelter and transportation services.
Individual Components:
Looking at table A below we can see that on an annual basis most of energy is still down but on a monthly basis it is up in December and January.
The biggest gainers on an annual basis were Services like Food away from home, Energy Services, Shelter, Transportation, and Medical Care Services.
 Although these “Seasonally Adjusted” numbers are slightly different than those typically presented by the BLS, the following chart from the Federal Reserve shows the gap between inflation with and without Food and Energy. So, we can see how much food and energy are contributing toward overall inflation.
Without food and energy, inflation would be 3.29%. But due to the downward pressure of Energy total inflation according to the FED is 3.00%.

Source: St. Louis FED
FED Monetary Policy
January 2025 Summary:
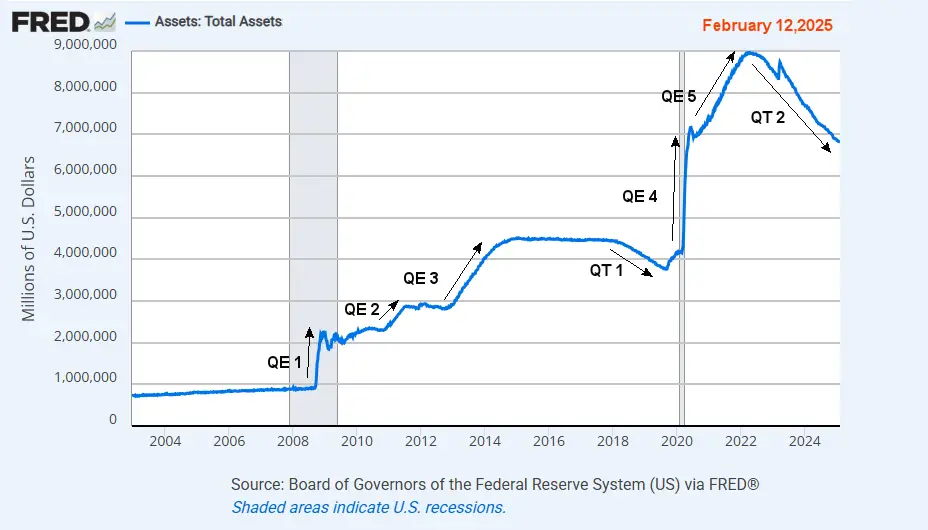
- FED Assets are Falling
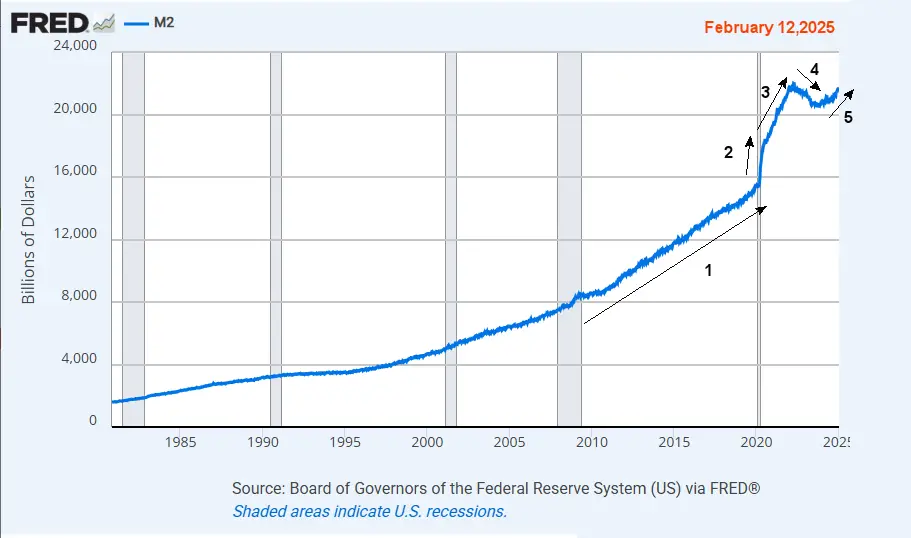
- M2 Money supply is rising
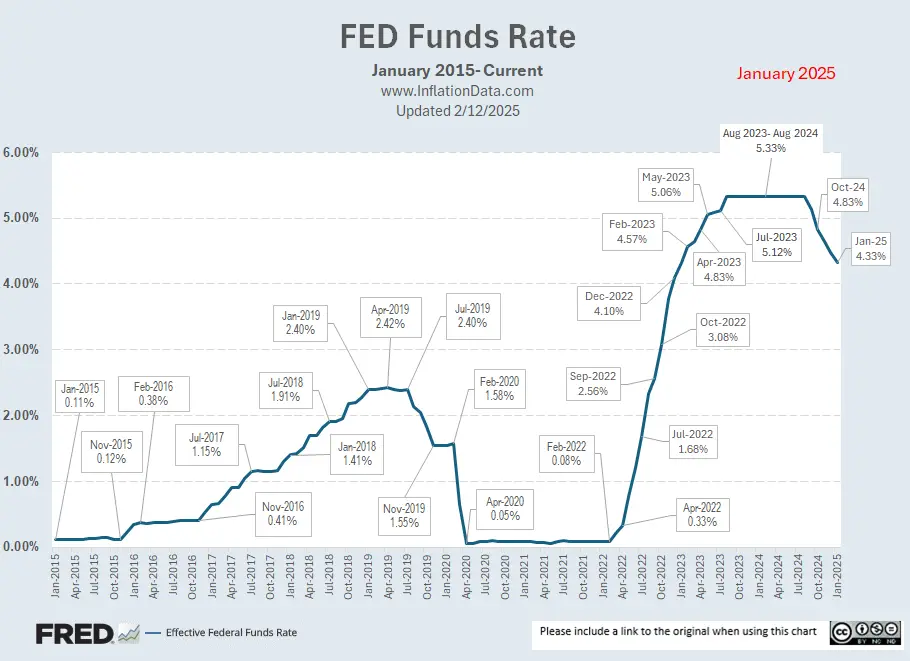
- FED Funds Rates Fell to 4.33%
FED Assets and M2 Money Supply
Looking at the M2 money supply we get a slightly different picture. Here we see a steady growth of the money supply from 2009 through 2020 (#1), then a sharp spike as we saw with FED assets (#2), and then a slightly less sharp incline (#3) (but longer duration for QE 5) taking M2 to 22 Trillion dollars in 2022. From 2022 to 2023 (#4) we see the decline we would expect due to the reduction of FED assets…
FED Funds Rate
More info about FED Monetary Policy and Inflation
Inflation Chart
Monthly Inflation Compared to Previous Years:
The monthly inflation rate for January 2025 was 0.65%.
In the chart below, we can see how the UNADJUSTED monthly inflation compares between 2020 (pink), 2021 (purple), 2022 (orange), 2023 (dark), 2024 (teal) and 2025 (brown). In 2024 monthly inflation started a bit higher than average at 0.54%, 0.62%, 0.65%, but April, May, and June 2024 came in significantly lower than 2023, which brought annual inflation down. November increased once again as 2023’s -0.20% was replaced by -0.05%. And then in December 0.04% replaced -0.10% once again causing Annual Inflation to rise. So far in 2025 January’s 0.65% was above 2024’s 0.54%.
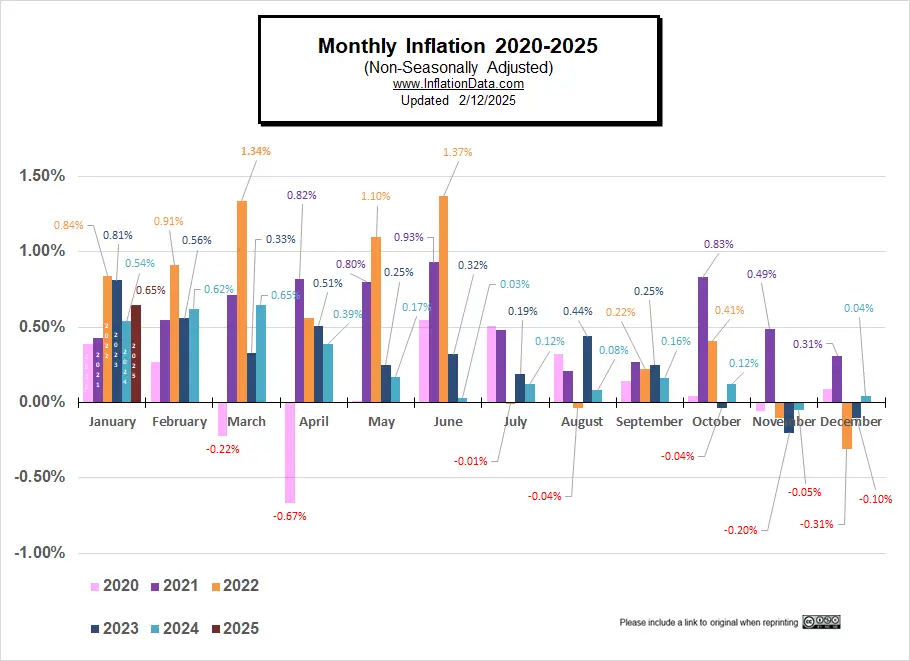
Not Seasonally Adjusted Monthly Inflation Rates
Note: January 2022’s 0.84% was the highest January since 1990. June was the highest June since 1941 (although the first quarter of 1980 had some higher rates). Typically, the first quarter has the highest monthly inflation and the 4th quarter is the lowest (even negative).
| Jan | Feb | Mar | Apr | May | Jun | Jul | Aug | Sep | Oct | Nov | Dec | |
| 2016 | 0.17% | 0.08% | 0.43% | 0.47% | 0.41% | 0.33% | (0.16%) | 0.09% | 0.24% | 0.12% | (0.16%) | 0.03% |
| 2017 | 0.58% | 0.31% | 0.08% | 0.30% | 0.09% | 0.09% | (0.07%) | 0.30% | 0.53% | (0.06%) | 0.002% | (0.06%) |
| 2018 | 0.54% | 0.45% | 0.23% | 0.40% | 0.42% | 0.16% | 0.01% | 0.06% | 0.12% | 0.18% | (0.33%) | (0.32%) |
| 2019 | 0.19% | 0.42% | 0.56% | 0.53% | 0.21% | 0.02% | 0.17% | (0.01%) | 0.08% | 0.23% | (0.05%) | (0.09%) |
| 2020 | 0.39% | 0.27% | (0.22%) | (0.67%) | 0.002% | 0.55% | 0.51% | 0.32% | 0.14% | 0.04% | (0.06%) | 0.09% |
| 2021 | 0.43% | 0.55% | 0.71% | 0.82% | 0.80% | 0.93% | 0.48% | 0.21% | 0.27% | 0.83% | 0.49% | 0.31% |
| 2022 | 0.84% | 0.91% | 1.34% | 0.56% | 1.10% | 1.37% | (0.01%) | (0.04%) | 0.22% | 0.41% | (0.10%) | (0.34%) |
| 2023 | 0.80% | 0.56% | 0.33% | 0.51% | 0.25% | 0.32% | 0.19% | 0.44% | 0.25% | (0.04%) | (0.20%) | (0.10%) |
| 2024 | 0.54% | 0.62% | 0.65% | 0.39% | 0.17% | 0.03% | 0.12% | 0.08% | 0.16% | 0.12% | (0.05%) | 0.04% |
| 2025 | 0.65% |
See: Monthly Inflation Rate for more information and a complete table of Unadjusted Monthly Rates.
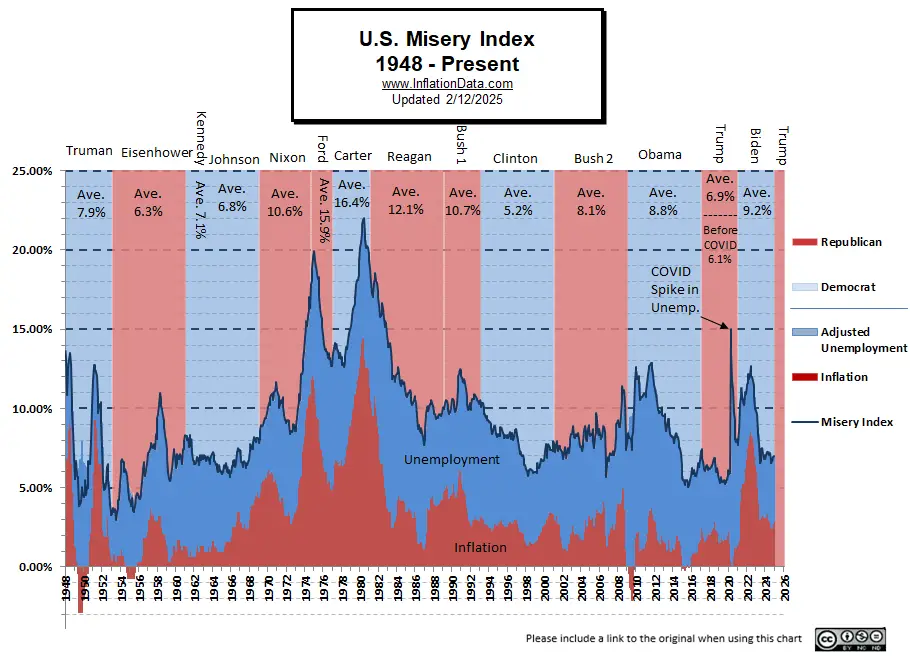
Misery Index
Current Misery Index:
Unemployment 4.0% + Inflation 3.00% = 7.00%
This month inflation is up but unemployment is down, so the misery index is up very slightly. For the first half of 2024 the Misery index hovered around 7% before falling to the high 6s. It finished the year at 6.99% before moving to 7% in January.
 [Read More on the Misery Index…]
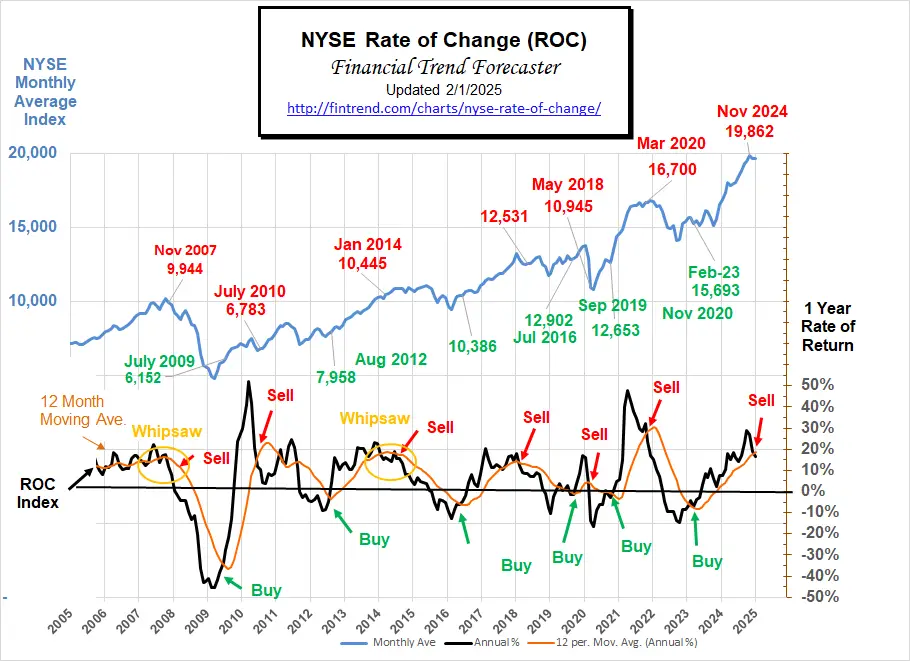
Rate of Change (ROC) Charts
The NYSE ROC issued a Sell Signal in November. But on the plus side, AI/Robotics Company Symbotic (SYM) was Up 18% in a single day in part due to its relationship with Walmart. And in a recent interview, Elon Musk was extremely bullish on the medium term (i.e. 3-5 years).
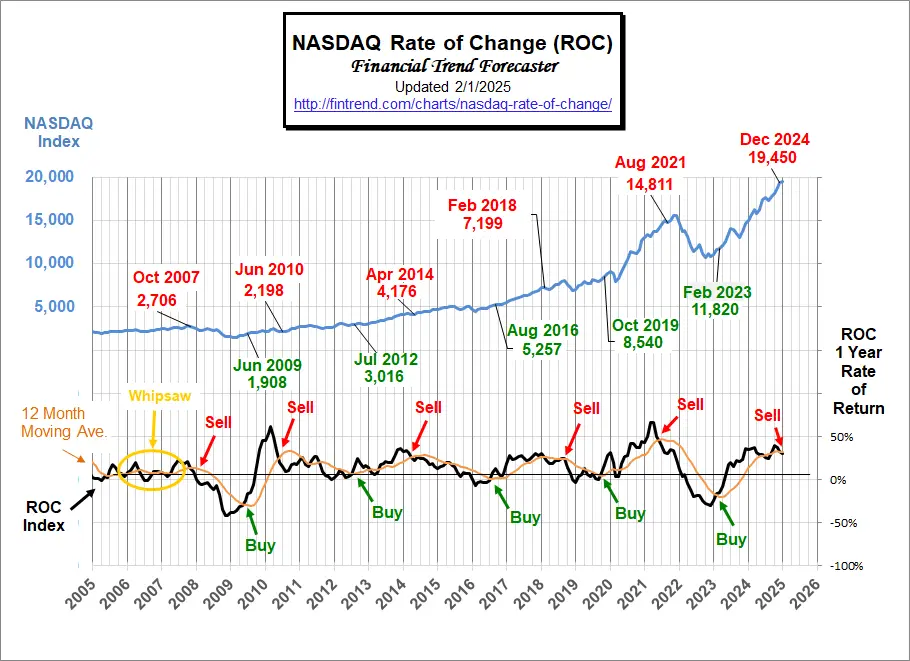
The NASDAQ ROC continues to flirt with its moving average, but now it is in Sell territory again. With both of the Index ROCs in Sell territory, we should be cautious.
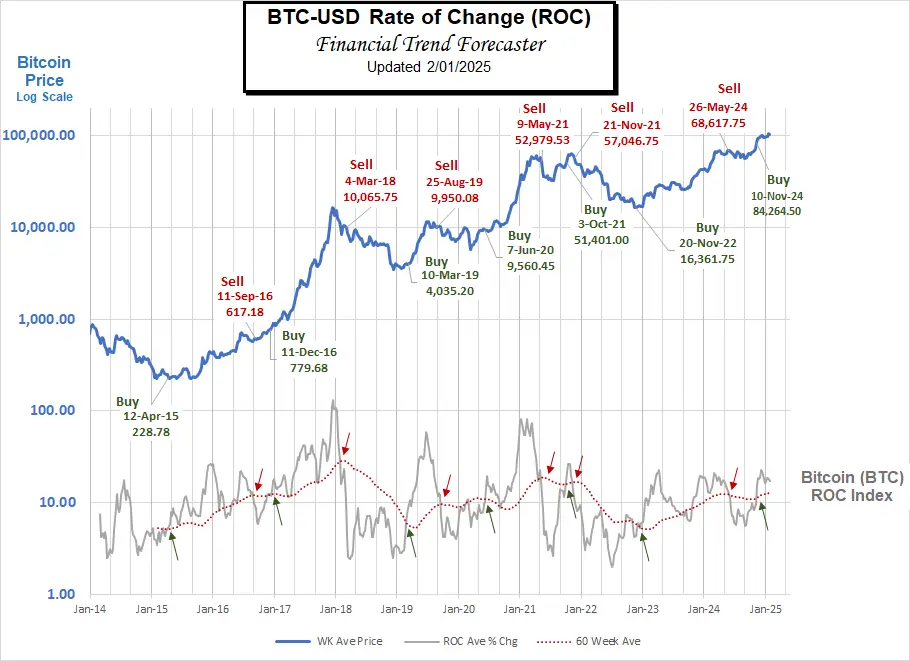
Bitcoin generated a buy signal in November and remains in Buy territory.
Ethereum on the other hand waited until December to issue its buy signal.
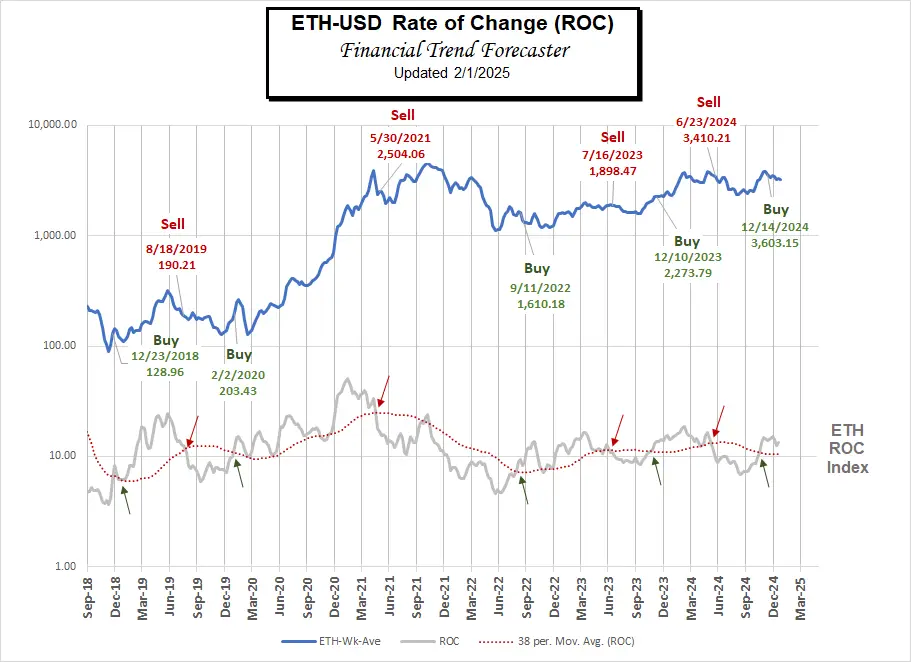
For more information, see NYSE Rate of Change (ROC) , NASDAQ ROC Chart, and Crypto ROC .
Inflation Adjusted Crude Oil Prices
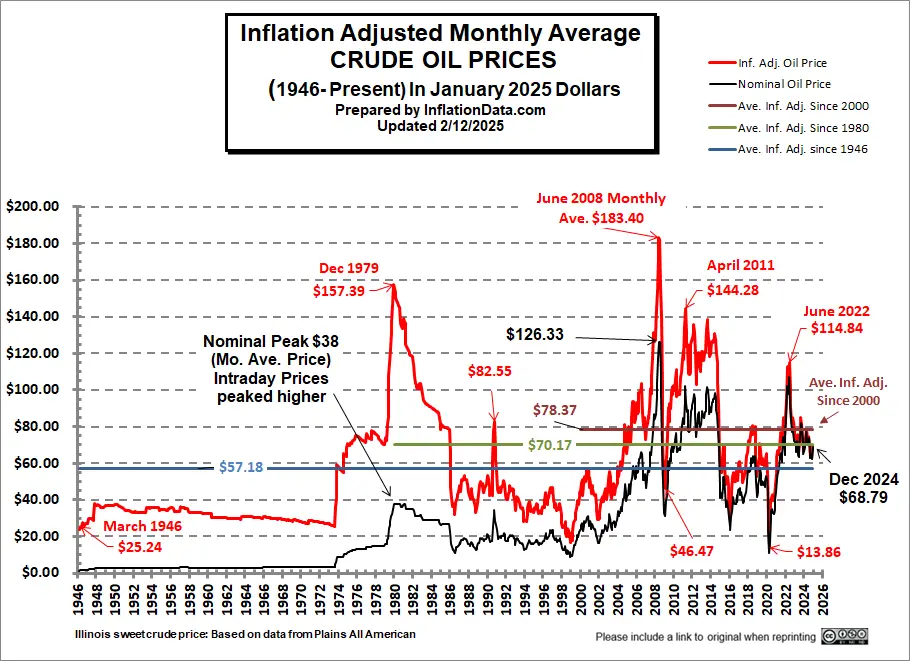
See Commentary On Inflation Adjusted Crude Oil Price Chart and Table
You Might Also Like:
From InflationData.com
- The Correlation Between Job Market Turnover and Inflation
- BLS releases its December 2024 Inflation report
- How Inflation Destroys Civilization
- Inflation and Retirees
- 2025 Social Security COLA
- Inflation-Proofing Your Family Budget
- FED Interest Rates
From Financial Trend Forecaster
- NYSE ROC
- NASDAQ ROC
- Crypto ROC
- See this month’s Moore Inflation Prediction
- Ethereum Buy Signal
- Income Inequality Misconceptions in the U.S.
- February Market Update- NYSE, NASDAQ and Crypto
- The Real Effects of Cutting Government Waste
- How Can Trump Drive Oil Prices Down AND Fill the SPR?
- Ethereum Buy Signal
- Bitcoin ROC Buy Signal
- One American’s Experience with Socialized Medicine
- Bitcoin Breaks Out
- Is Trump Right About Tariffs?
- What Makes MicroStrategy Special
- China’s Monetary Bazooka
- How Much is the Money Supply Growing?
- Is Gold Overpriced?
- Are Some Forms of Taxation Worse Than Others for the Economy?
From UnemploymentData.com.
- January 2025 BLS Employment Report
- December 2024 Unemployment Report
- November Unemployment Report
- October 2024 Employment / Unemployment Report
- Can We Trust the September Unemployment Numbers?
From Elliott Wave University
- Stock Prices are Out of This World
- Five Benefits of Using the Elliott Wave Principle to Make Decisions
- Invest Like Warren Buffet
- Gold Prices: The calm before a record run
- This Trend Will Likely Soon Rock the U.S. Financial System
From OptioMoney
- Tips for Mastering the Art of Bargaining and Negotiation After Moving to a New Country
- Consumer Culture Contrasting Spending Habits in the US and Europe
- Financial Considerations When Moving to Florida
- Splitting Your Golden Years:
- Home-Buying Guide for Newlyweds
From Your Family Finances
- Maintaining Value in a High-Inflation World
- What Homeowners Need to Know about Florida’s Property Insurance Crisis
- How to Get Money Interest Free
- How to Financially Prepare for Hurricane Season
- Key Considerations for Smooth Wealth Transfer Planning
Leave a Reply