According to the Bureau of Labor Statistics CPI report released on October 12th, Annual Inflation was unchanged at 3.7% in September.
(but since we calculate it to two digits, it was actually up from 3.67% to 3.70%.)
Monthly inflation went from 0.44% in August to 0.25% in September. But, even though monthly inflation was lower than last month, Annual inflation increased. This is because monthly inflation in September 2023 was slightly higher than monthly inflation in 2022. Thus, as the 2022 number fell out of the calculation, it was replaced by a slightly higher monthly number, thus increasing the Annual Inflation number.
September 2023 Inflation Summary:
- Annual Inflation rose from 3.67% to 3.70%
- CPI Index rose from 307.026 to 307.789
- Monthly Inflation for September was 0.25% and August was 0.44%.
- Next release November 14th, 2023
| Jan | Feb | Mar | Apr | May | June | July | Aug | Sep | Oct | Nov | Dec | |
| 2022 | 7.48% | 7.87% | 8.54% | 8.26% | 8.58% | 9.06% | 8.52% | 8.26% | 8.20% | 7.75% | 7.11% | 6.45% |
| 2023 | 6.41% | 6.04% | 4.98% | 4.93% | 4.05% | 2.97% | 3.18% | 3.67% | 3.70% |
The media of course always has their own agenda and the AP headline was:
US inflation eased slightly last month as price increases extend slow descent
Well … monthly inflation was lower so I guess you could say “inflation eased” but according to Annual Inflation which is what they usually talk about, you can only say it was unchanged (based on one decimal place) or up slightly (based on two decimal places). So, saying it eased slightly is somewhat misleading although technically true. And incidentally that was how Tucker Carlson says ALL News is reported, i.e., “somewhat misleading although technically true”.
As you can see our projection for September hit the nail right on the head.
Moore Inflation Predictor
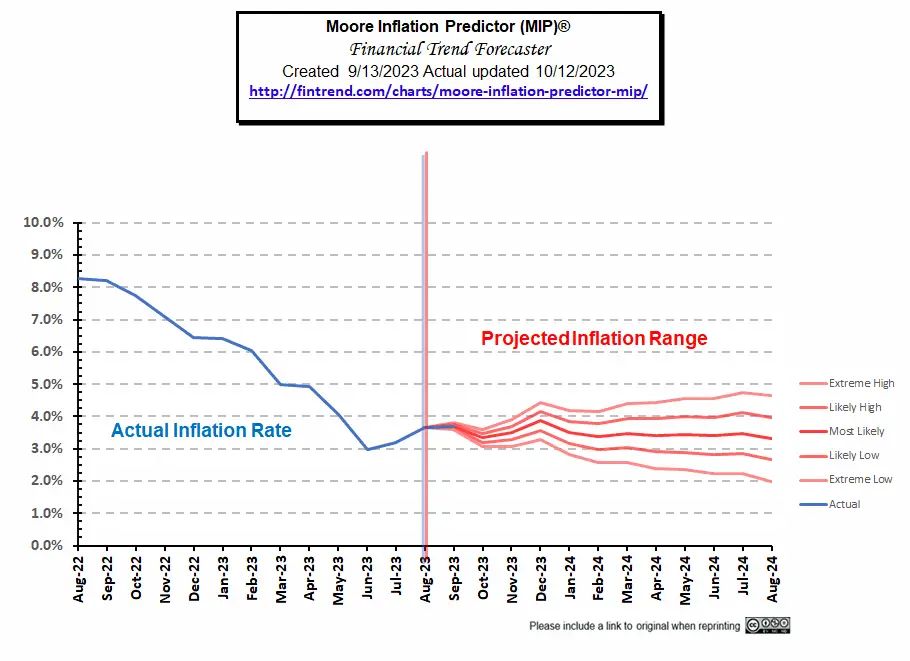 Go here to view our current MIP projection.
BLS Commentary:
The BLS Commissioner reported:
“The Consumer Price Index for All Urban Consumers (CPI-U) rose 0.4 percent in September on a seasonally adjusted basis, after increasing 0.6 percent in August, the U.S. Bureau of Labor Statistics reported today. Over the last 12 months, the all items index increased 3.7 percent before seasonal adjustment.
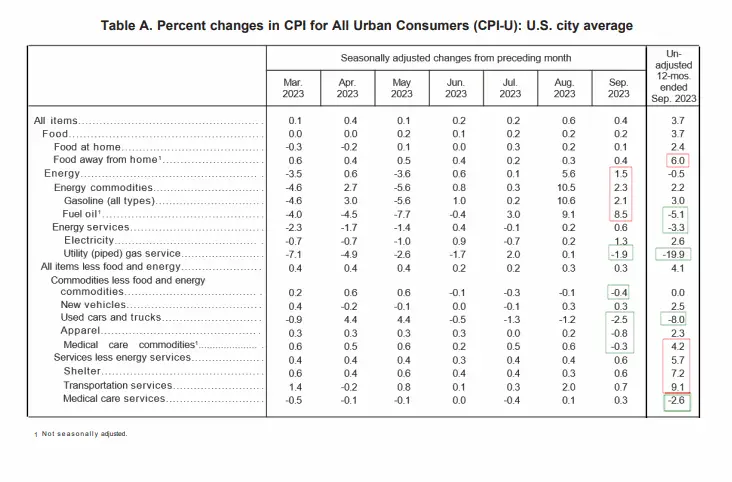
The index for shelter was the largest contributor to the monthly all items increase, accounting for over half of the increase. An increase in the gasoline index was also a major contributor to the all items monthly rise. While the major energy component indexes were mixed in September, the energy index rose 1.5 percent over the month. The food index increased 0.2 percent in September, as it did in the previous two months. The index for food at home increased 0.1 percent over the month while the index for food away from home rose 0.4 percent.”
I always think it is funny that they mention not Seasonally Adjusting the ANNUAL numbers as if that was even possible.
They continue to harp on Shelter as it is a large percentage of the index and it was up 7.2% for the year but…
Transportation Services was up 9.1% for the year and
Food away from home was up 6.0% for the year.
Obviously, the big news though was the monthly increases in the Energy sector with
Fuel Oil up 8.5% and Gasoline up 2.1% presumably because they stopped tapping the strategic petroleum reserves.
So, energy is no longer the major component holding inflation down although overall energy is still -0.5% below year-ago levels.
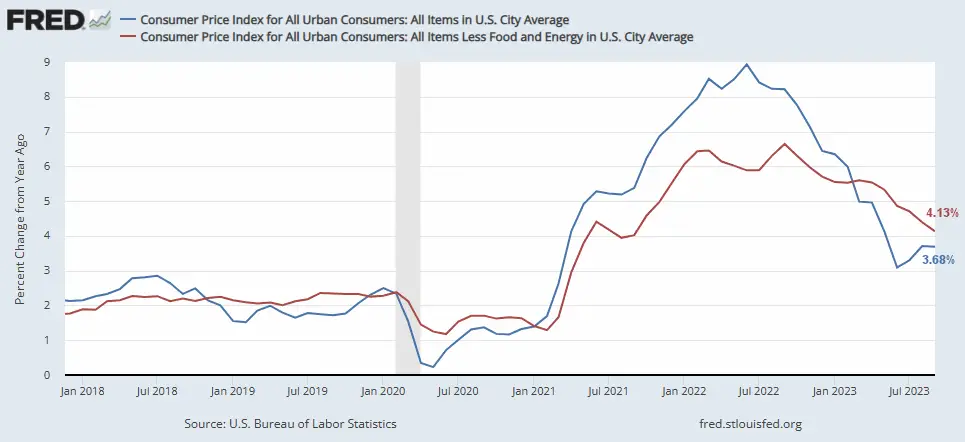
Although these “Seasonally Adjusted” numbers are slightly different than those presented by the BLS, the following chart from the Federal Reserve shows the gap between inflation with and without Food and Energy. Comparing the two we can see how much food and energy are contributing toward overall inflation.
If the blue line is above the red line, food and energy, are adding to the overall inflation rate. But if blue is below the red line, they are actually mitigating overall inflation. As the blue line rises toward the red line over the last couple of months, we note that energy is doing less and less to keep down overall inflation, i.e., energy prices are rising.
Source: St. Louis FED
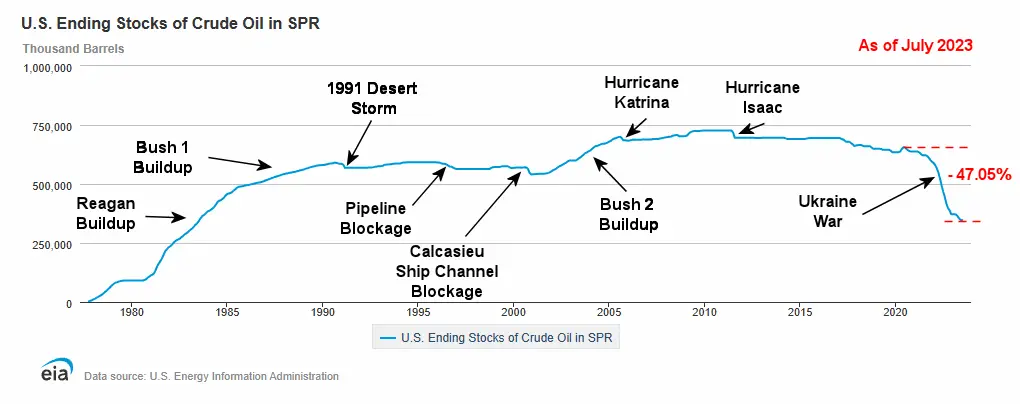
Overall energy prices have been down over the last year because the government has been flooding the market with cheap oil by depleting our strategic petroleum reserves. But at some point, they are going to have to replace those reserves (perhaps at much higher prices). Note: Reserves would have started at much higher levels had Democrats not refused Trump’s request to increase reserves when oil was cheap.
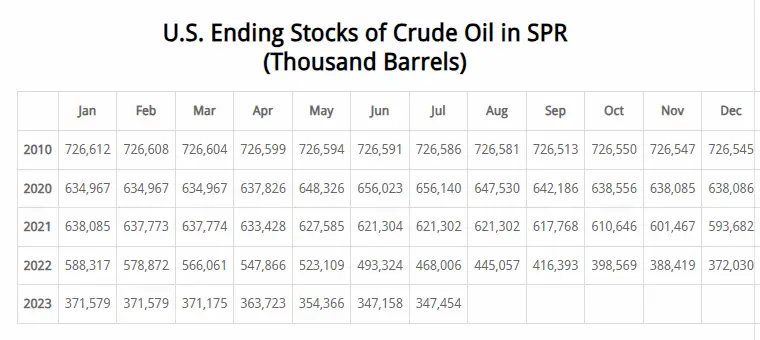
This chart from the U.S. EIA shows the extent of the recent strategic petroleum reserve drawdown compared to those of Desert Storm, various hurricanes, and other supply disruptions. Unfortunately, the E.I.A. is always a couple of months behind in updating its chart. But with the data we have we can see that the recent draw-down dwarfs all of the others combined. In July 2020, the SPR stood at 656,140,000 barrels.
As of June, the SPR was down to 347,158,000 or roughly -47.1% below July 2020 levels, which were already below 2010 levels. From January to February, levels were unchanged, so we were hoping that they had halted the drawdown, but drawdowns continued through June. In July there was a very slight increase to 347,454,000 (the most recent data available). This reduces the drawdown from -47.1% to -47.05%, i.e., virtually nothing. Perhaps, this slight increase is an effort to comply with the regs (see below) and claim that the next drawdown is a “new event”. We will see if the drawdown resumes or if supplies continue increasing.
 According to the statutory drawdown rules this drawdown looks illegal. The rules regarding drawdown of the SPR are:
In no case may the Reserve be drawn down under this subsection –
(A) in excess of an aggregate of 30,000,000 barrels with respect to each such shortage;
(B) for more than 60 days with respect to each such shortage;
Since the drawdown has been going on for over a year and a half, and is currently about 9x higher than the max in section A it doesn’t look Kosher to me. Also, I don’t see anywhere on the EIA site where it explains how the current drawdown deal works. Typically, oil is loaned and repaid with more oil at a later date… is this happening or is it being sold for cash? If cash where is all that money going? Are any kickbacks involved? Who knows? I suggest you write your Congressmen and Senators and ask these questions. You can find your Representatives here.
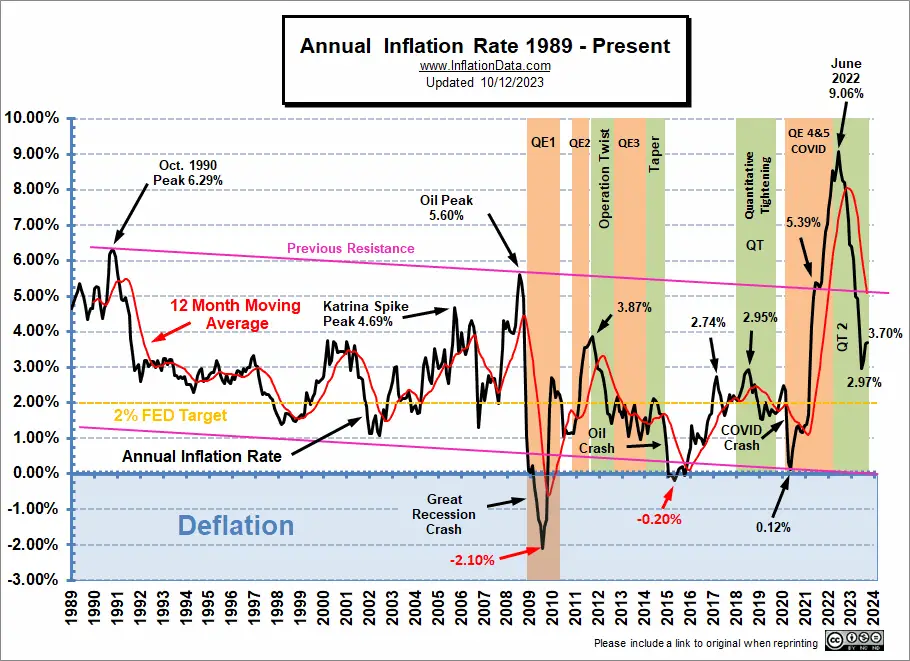
Inflation Chart since 1989
Beginning in 1989, the longer-term trend was downward until 2021.
(Note the declining “previous resistance” line.) But… Early in 2021, inflation started spiking and quickly broke through the channel’s top and then exceeded the pink previous resistance line with barely a hiccup as it passed through. Now inflation has crossed back down into that channel (with April generating another hiccup as it passed through). With rising gasoline prices, September 2023, saw annual inflation increase slightly to 3.70% from 3.67% in August.
FED Actions
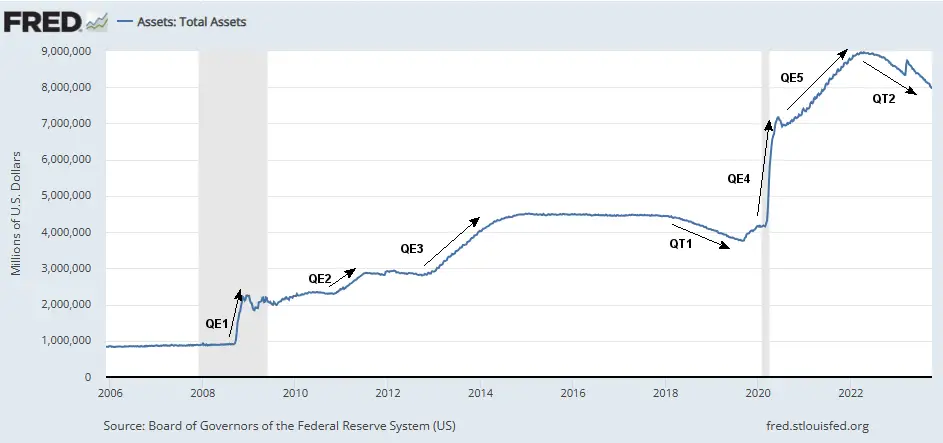
Back in April 2020, we published the March FED Assets chart showing that FED assets could easily reach 9 Trillion…
And two years later, that is precisely what happened. FED assets peaked at 8.965 Trillion on April 13th, 2022.
By December 7th, FED assets were down to 8.582 Trillion, and on March 1st, they had bottomed at 8.39 Trillion, for roughly a 2/3 Trillion decrease. (As we can see from the chart below, that is still only a fraction of QE5 alone, which started at around 7 Trillion).
But then a banking crisis broke out in California, and the FED jumped it back up to 8.733 trillion on March 22nd wiping out roughly 38% of the gains they made. Since then, the FED has started decreasing assets again and assets are down almost a Trillion from the peak. But still less than half of QE5 and then there is still QE 1-4 …
See more commentary on FED Actions here, here, and here.
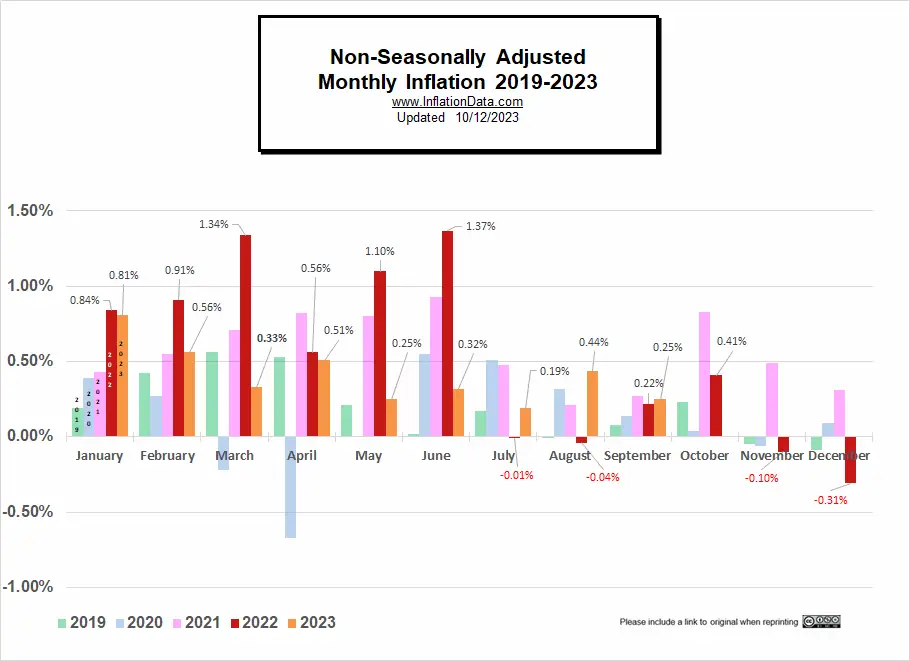
Monthly Inflation Compared to Previous Years:
The monthly inflation rate for September 2023 was 0.25%
In the chart below, we can see how the monthly inflation compares between 2019 (light green), 2020 (light blue), 2021 (pink), 2022 (red), and 2023 (orange). 2022 started out with very high monthly inflation 0.84% (January), 0.91% (February), and 1.34% (March) even for the first quarter of a year when monthly inflation is already at its highest. Typically, monthly inflation is highest from January through May, often in the 0.30% to 0.50% range.
May 2022’s 1.10% was extremely high even for the high months, so being replaced by the relatively low 0.25% of May 2023 knocked annual inflation way down.
Typically, in June, inflation moderates into a lower range, but in 2022 monthly inflation in June was also high, i.e., 1.37%. So the two-month inflation for May and June alone was 2.49%.
But then comes July 2022 which had negative monthly inflation (i.e., disinflationary), although it was virtually zero. So, monthly inflation of 0.19% in July 2023 increased the annual inflation rate to 3.18% and August 2023’s 0.44% was significantly higher than August 2022’s -0.04%.
Usually, monthly inflation is very low or even negative from October through December, helping to reduce annual inflation. But October brings a glimmer of hope for a slight decline if monthly inflation is below 0.41%.
Not Seasonally Adjusted Monthly Inflation Rates
Note: January 2022’s 0.84% was the highest January since 1990. June was the highest June since 1941 (although the first quarter of 1980 had some higher rates). Typically, June is the beginning of lower monthly rates.
| Jan | Feb | Mar | Apr | May | Jun | Jul | Aug | Sep | Oct | Nov | Dec | |
| 2016 | 0.17% | 0.08% | 0.43% | 0.47% | 0.41% | 0.33% | (0.16%) | 0.09% | 0.24% | 0.12% | (0.16%) | 0.03% |
| 2017 | 0.58% | 0.31% | 0.08% | 0.30% | 0.09% | 0.09% | (0.07%) | 0.30% | 0.53% | (0.06%) | 0.002% | (0.06%) |
| 2018 | 0.54% | 0.45% | 0.23% | 0.40% | 0.42% | 0.16% | 0.01% | 0.06% | 0.12% | 0.18% | (0.33%) | (0.32%) |
| 2019 | 0.19% | 0.42% | 0.56% | 0.53% | 0.21% | 0.02% | 0.17% | (0.01%) | 0.08% | 0.23% | (0.05%) | (0.09%) |
| 2020 | 0.39% | 0.27% | (0.22%) | (0.67%) | 0.002% | 0.55% | 0.51% | 0.32% | 0.14% | 0.04% | (0.06%) | 0.09% |
| 2021 | 0.43% | 0.55% | 0.71% | 0.82% | 0.80% | 0.93% | 0.48% | 0.21% | 0.27% | 0.83% | 0.49% | 0.31% |
| 2022 | 0.84% | 0.91% | 1.34% | 0.56% | 1.10% | 1.37% | (0.01%) | (0.04%) | 0.22% | 0.41% | (0.10%) | (0.34%) |
| 2023 | 0.80% | 0.56% | 0.33% | 0.51% | 0.25% | 0.32% | 0.19% | 0.44% | 0.25% |
See: Monthly Inflation Rate for more information and a complete table of Unadjusted Monthly Rates.
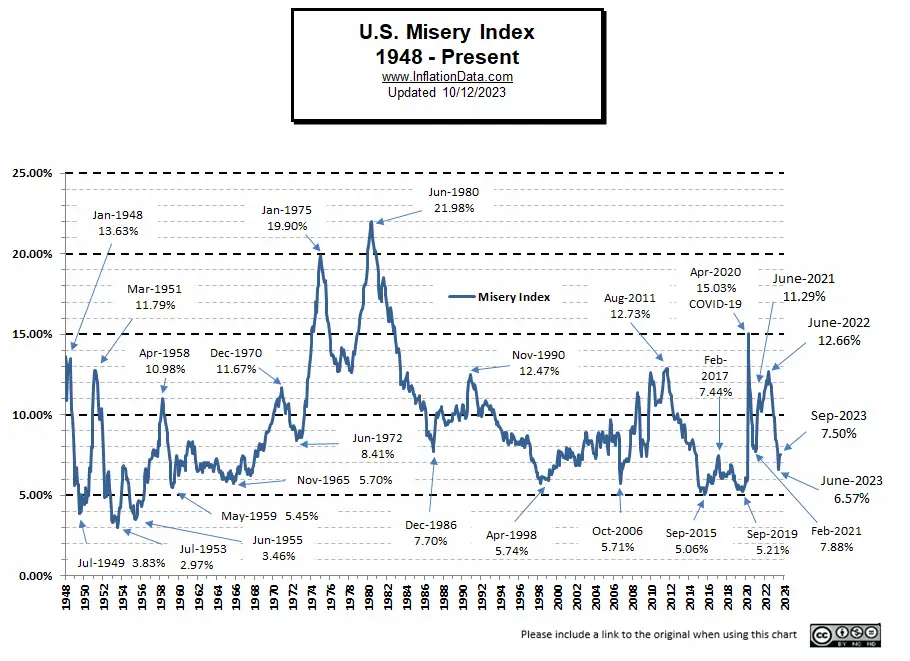
Misery Index
Current Misery Index: Unemployment 3.8% + Inflation 3.70% = 7.50%
[Read More on the Misery Index…]
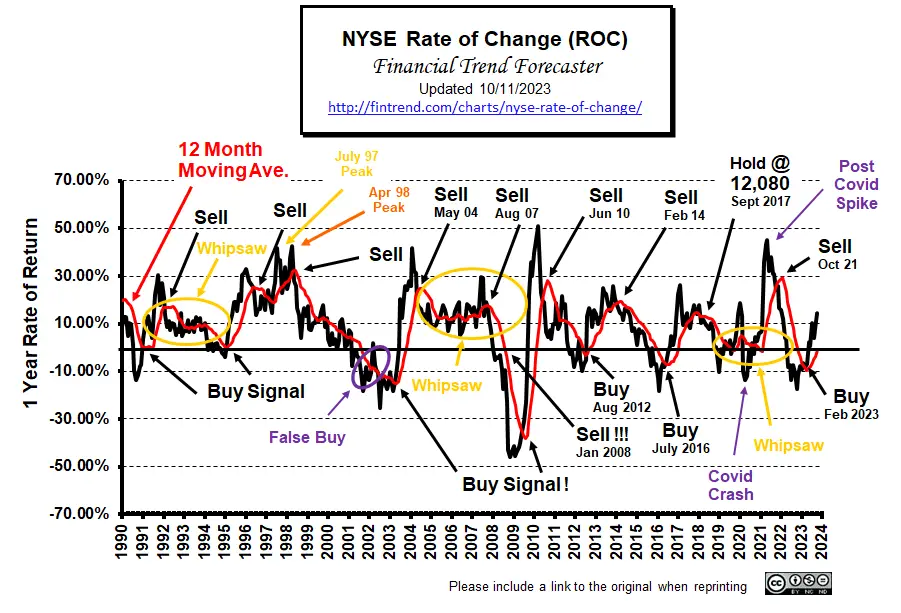
NYSE Rate of Change (ROC)
In February 2023, the NYSE- ROC crossed back above its 12-month moving average, generating a BUY Signal…
Then we received confirmation that the signal was real in that the index had crossed back above the zero line. So far, the market has taken a break for the Summer. But at this point, it still looks like the market is recovering.
For more information, see NYSE Rate of Change (ROC) and NASDAQ ROC Chart.
You Might Also Like:
From InflationData.com
- Playing with Official Inflation Statistics: An Example from Germany
- Increasing Inflation Now Shifting Insurance Rates
- August 2023 Inflation Up Sharply
- Can the FED Engineer a “Soft Landing”?
- Inflation Is a Huge Wealth Redistribution Scheme
From Financial Trend Forecaster
- NYSE ROC Chart
- NASDAQ ROC Chart
- The Dangerous Myth of a “Soft Landing”
- The Crux of China’s Problems
- Will a New BRICS Currency Dethrone the U.S. Dollar?
- The European Energy Crisis May Be Back Soon
- What Made Maui’s Lahaina Fire So Deadly?
- Which is Worse- Easy Money or Public Debt?
From UnemploymentData.com.
- October Unemployment Report for September 2023
- Getting Hired: Tips for Finding Work as a Recent College Graduate
- Is Your Job Making You Sick?
- How to Become an Owner Operator in Trucking
- Need a Change of Pace? 3 Keys to Finding a New Job Quickly
From Elliott Wave University
- Why You Should Expect a Once-in-a-Lifetime Debt Crisis
- Why Do Traders Really Lose Money?
- Quick Takes on Big Financial Trends
- Extremely Rare Market Signal Just Triggered
- Stocks and Junk Bonds: “This Divergence Appears Meaningful”
From OptioMoney
- DIY vs. Professional Movers
- 7 Ways to Increase the Value of Your Home
- Is a Home Warranty a Good Investment?
- What Happens to Old Solar Panels?
- The Art of DIY: Saving Money by Learning New Skills
From Your Family Finances
- How Much You Should Be Saving for Unexpected Home Repairs
- Transforming Your Money Mindset for a Brighter Future
- The Benefits of Downsizing
- What Causes Drafty Windows?
- The Advantages of Home Owner’s Insurance


Leave a Reply