According to the Bureau of Labor Statistics CPI report released on May 10th, Annual Inflation declined by 0.1%…
but according to our calculations, it was even less than that.
The BLS reported a decline from 5% to 4.9%, but when carried to two decimals, it was virtually a rounding error difference.
Monthly inflation was 0.51% for April 2023, compared to 0.56% in April 2022.
April 2023 Inflation Summary:
- Annual Inflation fell from 4.98% to 4.93%
- CPI Index rose from 301.836 to 303.363
- Monthly Inflation for April was 0.51%
- Next release June 13th 2023
| Jan | Feb | Mar | Apr | May | June | July | Aug | Sep | Oct | Nov | Dec | |
| 2022 | 7.48% | 7.87% | 8.54% | 8.26% | 8.58% | 9.06% | 8.52% | 8.26% | 8.20% | 7.75% | 7.11% | 6.45% |
| 2023 | 6.41% | 6.04% | 4.98% | 4.93% |
Who said it?
“Unless you have a free press in your country, there is no need to buy newspapers and there is no need to watch the news because there is no need to listen to the lies! And you already have one real information: You are being deceived by the people you are governed! This is an enough information for you!”
The Answer is at the Bottom of the page.
Truth in Reporting?
NBC reported that “Inflation… the lowest it’s been in two years”, while that is technically true, it is a bit misleading. Newsday’s headline is almost the opposite but perhaps a bit closer to the mark, saying “Prices pick up, showing inflation pressures persist,” but also misleading.
No matter what you think about him, it is interesting to note that Tucker Carlson addressed the issue of truth in the media in a Tweet, saying that although not technically lying, both sides of the media shade the truth, and avoid the real issues in order to present their agenda. “Facts have been withheld on purpose along with proportion and perspective”.
And that is exactly what we are seeing in these two contradictory headlines.
Yes, inflation pressures persist, but quite a few prices were actually lower in April than in March, as we can see from “Table A” (Circled in Green), and only 3 categories were significantly higher than in March (circled in red). And yes, inflation is the lowest in two years, but by less than one-tenth of one percent (virtually nil).
So, the truth is that inflation is still high, and there was very little change in the Annual inflation rate between last month and this month. The BLS says it went from 5% to 4.9%, but if you calculate it to a few more decimal places, you see it went from 4.98% to 4.93%, i.e., virtually a rounding error.
It is also important to remember that even if the inflation RATE is falling… prices are still going up, i.e., prices are almost 5% higher than they were a year ago. At 4.93% annual inflation, prices will double in roughly 14.6 years.
BLS Commentary:
“The Consumer Price Index for All Urban Consumers (CPI-U) rose 0.4 percent in April on a seasonally adjusted basis after increasing 0.1 percent in March, the U.S. Bureau of Labor Statistics reported today. Over the last 12 months, the all items index increased 4.9 percent before seasonal adjustment.
The index for shelter was the largest contributor to the monthly all items increase, followed by increases in the index for used cars and trucks and the index for gasoline. The increase in the gasoline index more than offset declines in other energy component indexes, and the energy index rose 0.6 percent in April. The food index was unchanged in April, as it was in March. The index for food at home fell 0.2 percent over the month while the index for food away from home rose 0.4 percent.”
On an annual (non-adjusted) basis, inflation fell from 4.98% to 4.93%.
The reason the Commissioner blames the rise on shelter costs is that they make up a fairly significant portion of the total CPI, making up 34.413% of the total index. Of that, roughly 4% is due to household energy usage, so had fuel oil and Natural Gas (piped) prices not declined, shelter costs would be even higher.
To see the entire percentage breakdown of the CPI, go here.
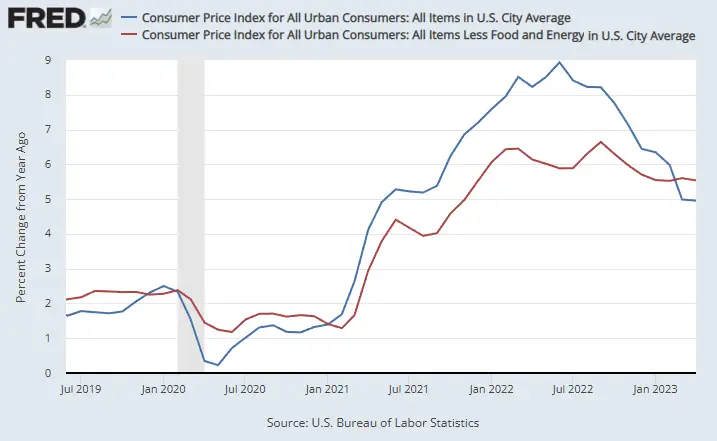
The following chart shows the CPI vs. the CPI excluding Food and Energy. Of course, food and energy are major components of what Consumers spend each month. But they are also affected most by outside factors like weather and OPEC. So, comparing the two indexes can give us some insight into where the inflation is coming from.
The gap between the two shows how much food and energy are contributing toward overall inflation. This month rather than food and energy adding to the overall inflation rate, they are actually reducing the overall rate, i.e., the blue line (including food and energy) is below the red line (without food and energy). That is because energy prices are currently -5.1% below year-ago rates, but Gasoline and “Energy Commodities” are up 3% and 2.7% on a monthly basis.
Source: St. Louis FED
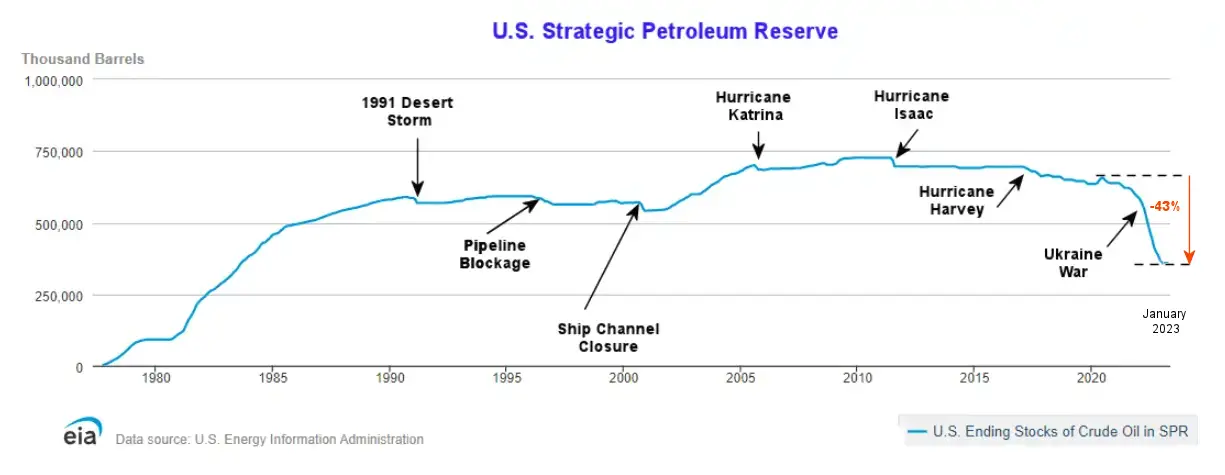
One reason overall energy prices are down over the last year is that the government has been flooding the market with cheap oil by depleting our strategic petroleum reserves. But at some point, they are going to have to replace those reserves (perhaps at much higher prices).
Note: Reserves would have started at much higher levels had Democrats not refused Trump’s request to increase reserves when oil was cheap.
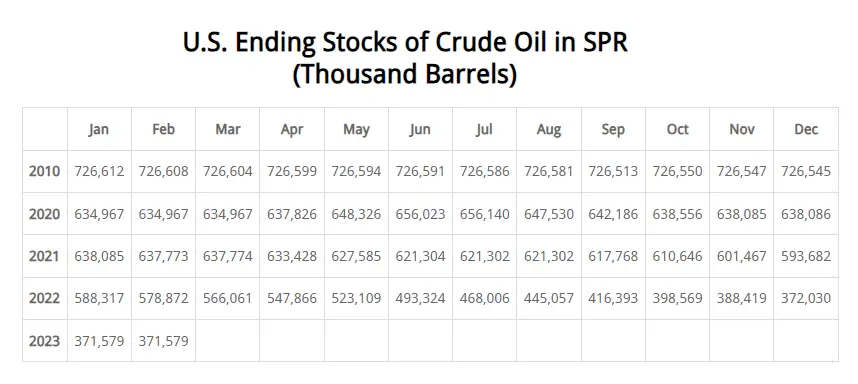
In this chart from the U.S. EIA, we can see the extent of the recent strategic petroleum reserve drawdown compared to those of Desert Storm, various hurricanes, and other supply disruptions. The recent draw-down dwarfs all of the others combined. Unfortunately, the E.I.A. is always a couple of months behind in updating its chart. As of February, the SPR was down -43% from 2020 levels which was already below 2010 levels. But it was unchanged from January, so perhaps they halted the drawdown.
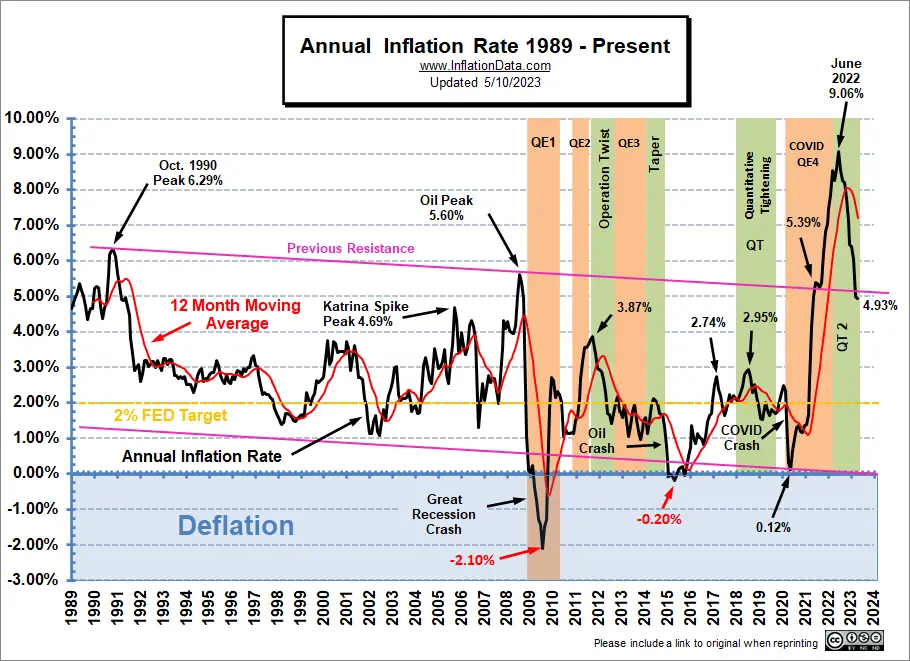
Inflation Chart since 1989
Beginning in 1989, the longer-term trend was downward until 2021.
(Note the declining “previous resistance” line.) But… Early in 2021, inflation started spiking and quickly broke through the channel’s top and then exceeded the pink previous resistance line with barely a hiccup as it passed through. Now inflation has crossed back down into that channel (with April generating the hiccup this time).
FED Actions
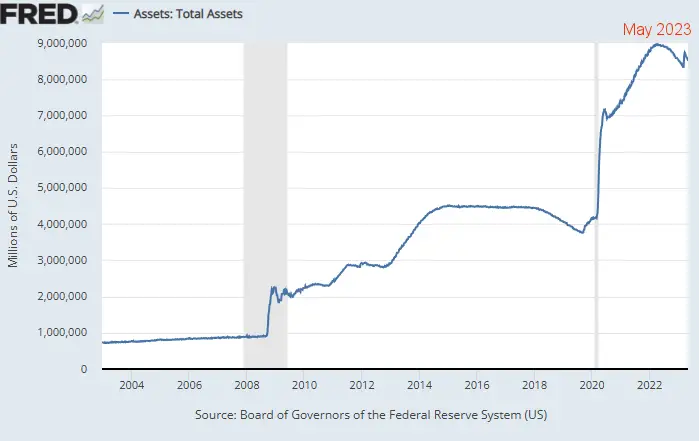
The FED has been reducing “FED Assets” in an effort to fight inflation for almost a year now. But then the Banking crisis broke out in California and the FED wiped out much of their progress in a single week. They have resumed their reduction of assets but haven’t made it back to where they were yet.
See the more commentary on FED Actions here, here, and here.
Monthly Inflation Compared to Previous Years:
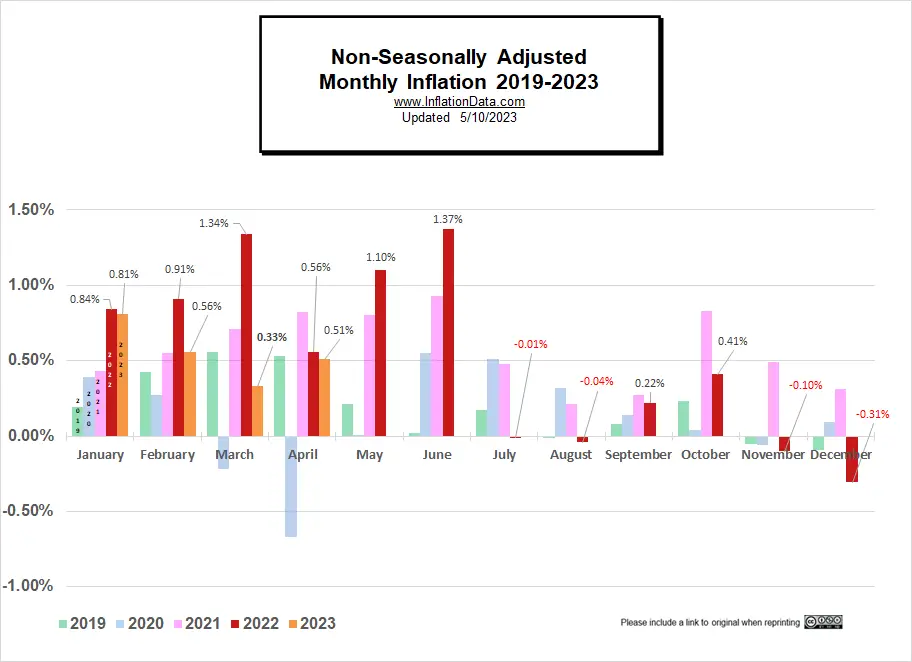
In the chart below, we can see how the monthly inflation compares between 2019 (light green), 2020 (light blue), 2021 (pink), 2022 (red), and 2023 (orange). We can see that virtually every month in 2021 was above the corresponding month in 2020, but in 2022, April and July-December were below 2021’s level.
In 2023 so far, January was slightly lower than January 2022, February was considerably lower than in 2022, March was massively lower than 2022, and April was just slightly lower.
Not Seasonally Adjusted Monthly Inflation Rates
Note: January 2022’s 0.84% was the highest January since 1990. June was the highest June since 1941 (although the first quarter of 1980 had some higher rates). Typically, June is the beginning of lower monthly rates.
| Jan | Feb | Mar | Apr | May | Jun | Jul | Aug | Sep | Oct | Nov | Dec | |
| 2016 | 0.17% | 0.08% | 0.43% | 0.47% | 0.41% | 0.33% | (0.16%) | 0.09% | 0.24% | 0.12% | (0.16%) | 0.03% |
| 2017 | 0.58% | 0.31% | 0.08% | 0.30% | 0.09% | 0.09% | (0.07%) | 0.30% | 0.53% | (0.06%) | 0.002% | (0.06%) |
| 2018 | 0.54% | 0.45% | 0.23% | 0.40% | 0.42% | 0.16% | 0.01% | 0.06% | 0.12% | 0.18% | (0.33%) | (0.32%) |
| 2019 | 0.19% | 0.42% | 0.56% | 0.53% | 0.21% | 0.02% | 0.17% | (0.01%) | 0.08% | 0.23% | (0.05%) | (0.09%) |
| 2020 | 0.39% | 0.27% | (0.22%) | (0.67%) | 0.002% | 0.55% | 0.51% | 0.32% | 0.14% | 0.04% | (0.06%) | 0.09% |
| 2021 | 0.43% | 0.55% | 0.71% | 0.82% | 0.80% | 0.93% | 0.48% | 0.21% | 0.27% | 0.83% | 0.49% | 0.31% |
| 2022 | 0.84% | 0.91% | 1.34% | 0.56% | 1.10% | 1.37% | (0.01%) | (0.04%) | 0.22% | 0.41% | (0.10%) | (0.34%) |
| 2023 | 0.80% | 0.56% | 0.33% | 0.51% |
See: Monthly Inflation Rate for more information and a complete table of Unadjusted Monthly Rates.
Misery Index
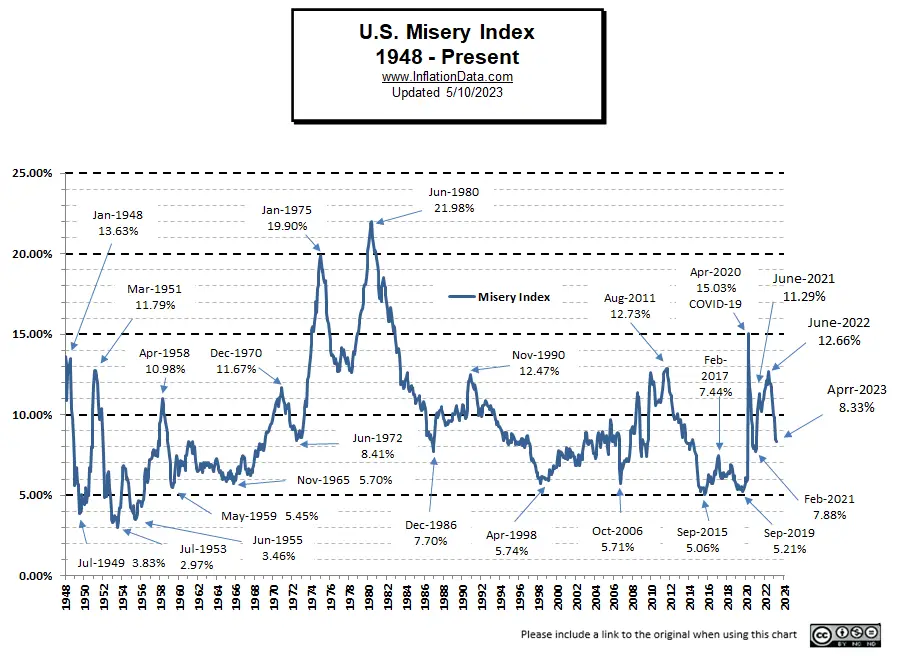
Unemployment and Inflation were both down slightly, bringing the Misery Index down from 8.48% to 8.33%.
[Read More on the Misery Index…]
NYSE Rate of Change (ROC)
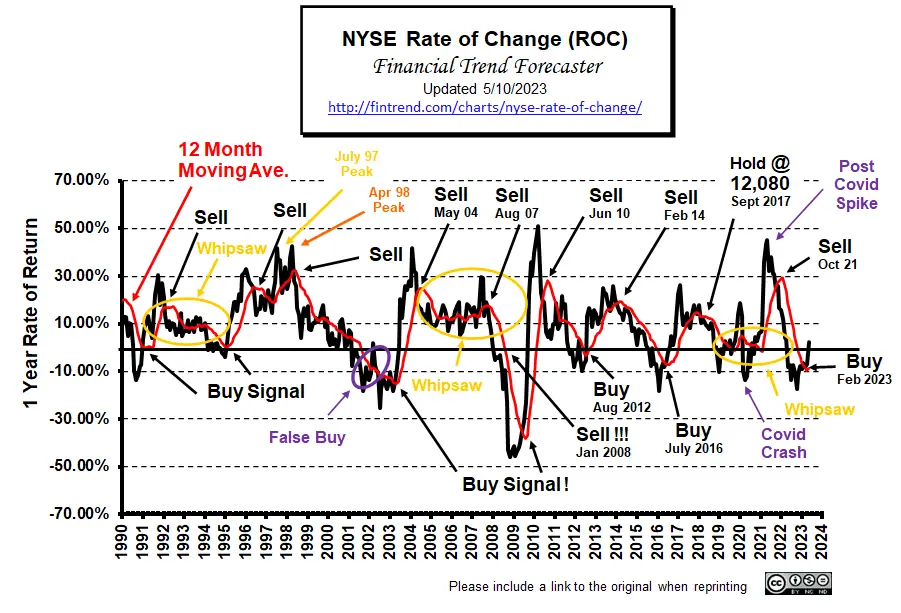
In February 2023, the NYSE- ROC crossed back above its 12-month moving average, generating a BUY Signal, But…
We said, “Looking at the chart, we can see that the annual return is still below zero, and caution is still warranted, but this is a buy signal. There is still the possibility of something like the false buy signal of 2001-2002 if the FED gets too aggressive with its tightening, but we shouldn’t ignore this signal!”
Last month we asked: Was January’s ROC signal a False Buy Signal?
We said, Possibly, but it could also be a good buying opportunity. The best buys come when your gut is telling you to sell or at least be cautious. But buying at that point is extremely tricky to do. That is why we advised a scheduled phase-in plan to get back in the market rather than dumping all your money back in immediately. If you have it automated to reinvest a portion of your funds each month, you take the emotion out of the equation and can take advantage of “dollar cost averaging”.
At this point, the market is still giving off mixed signals, and despite the market being slightly lower than in February, the NYSE ROC is up sharply, confirming the buy signal and crossing above the zero line.
Answer to Who said it?
Contemporary Turkish playwright, novelist and thinker Mehmet Murat ildan said:
“Unless you have a free press in your country, there is no need to buy newspapers and there is no need to watch the news because there is no need to listen to the lies! And you already have one real information: You are being deceived by the people you are governed! This is an enough information for you!”
For more information, see NYSE Rate of Change (ROC) and NASDAQ ROC Chart.
You Might Also Like:
From InflationData.com
- Can the Dollar Retain Its Ultimate Currency Status?”
- What are “Sticky Prices” and Why Do They Matter?
- The 3 Major Causes of Bank Problems
- Central Banks Respond Differently to the Banking Crisis
- How Loose Monetary Policies Cause Recessions
From Financial Trend Forecaster
- NYSE ROC Chart
- NASDAQ ROC Chart
- The Bullish and Bearish Cases in the Market
- Commercial Banks Suffer Along With Commercial Real Estate
- Big Move Coming in Stocks
- The Bullish and Bearish Cases in the Market
- More Cracks in U.S. Dollar Dominance
- Do “Red States” Really Ride the “Blue State” Gravy Train?
From UnemploymentData.com.
- April Employment Nears All-Time Highs
- Work Injury? Short-Term Income Options While You Mend
- March: Full Employment?
- 5 Must-Know Tips for Optimizing Your Job Search
From Elliott Wave University
- Corporate Bonds: “The Next Shoe to Drop”?
- Silicon Valley Bank, Silvergate and “The Everything Bust”
- Bull Trap or Market Consolidation?
- 60% stocks, 40% bonds? Ha!
- U.S. Dollar: Has the Mainstream Been Way Too Confident?
- Banks Are Becoming More Cautious About Lending
From OptioMoney
- How Buying a House Affects Your Finances
- Top Personal Finance Apps of 2023
- How to Deal with Financially Irresponsible Family Members
- How to Financially Prepare for a Baby
- 6 Ways to Cope with Bad Financial Decisions
From Your Family Finances
- How to Get the Most Out of Your Auto Insurance
- The Financial Benefits of Installing Solar Panels
- Life Insurance or Annuity?
- You Get What You Pay for in Cheese
- Mortgages for the Self-Employed



Leave a Reply