
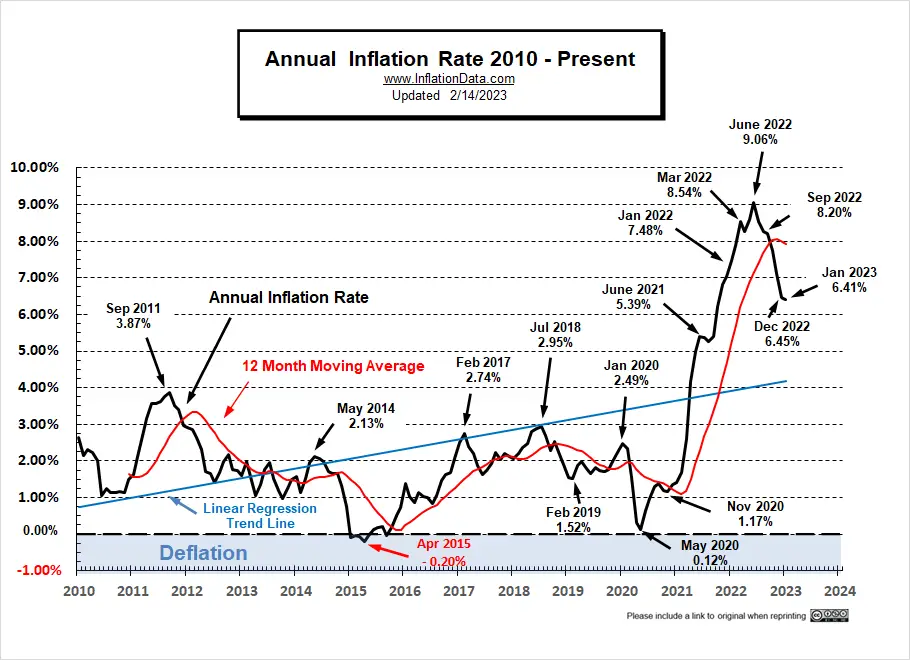
The Bureau of Labor Statistics reported that Annual Inflation fell from 6.45% in December 2022 to 6.41% in January 2023.
Monthly inflation was much higher than expected for January, resulting in a much smaller loss than most experts predicted.
With 0.84% monthly inflation for January set to fall out of the calculations, the opportunity for a significant drop in inflation was possible. Monthly inflation for both November and December was negative so it seemed possible that January inflation could be moderate, but instead, it came in at a whopping 0.80%, just 0.04% lower than January 2022, resulting in a minuscule 0.04% decline in the annual inflation rate.
January Inflation Summary:
- Annual Inflation fell from 6.45% to 6.41%
- CPI Index rose from 296.797 to 299.170
- Monthly Inflation for January was 0.80%
- Next release March 14th 2023
| Jan | Feb | Mar | Apr | May | June | July | Aug | Sep | Oct | Nov | Dec | |
| 2022 | 7.48% | 7.87% | 8.54% | 8.26% | 8.58% | 9.06% | 8.52% | 8.26% | 8.20% | 7.75% | 7.11% | 6.45% |
| 2023 | 6.41% |
The NYSE stock market initially sold off and was down 0.6% the next day. While the NASDAQ was basically flat for the day and up over 8% for the month.
BLS January Inflation Components:
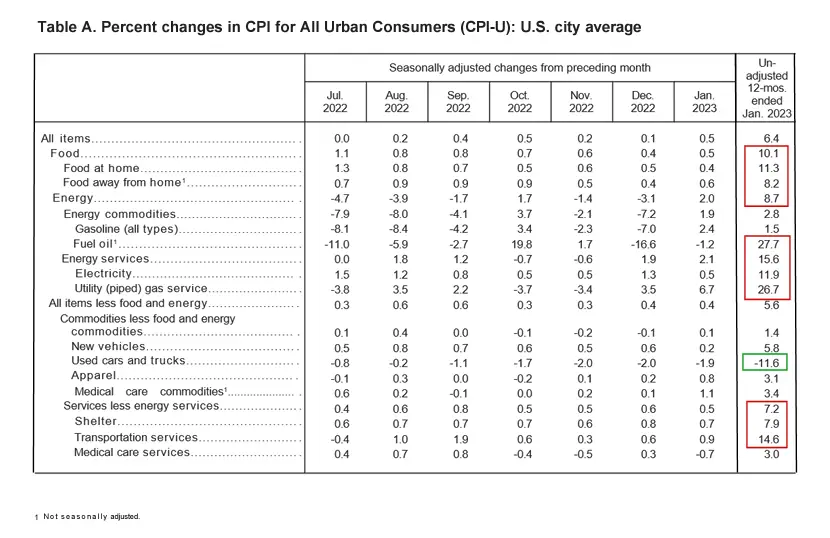
BLS Commentary:
The BLS Commissioner reported “The Consumer Price Index for All Urban Consumers (CPI-U) rose 0.5 percent in January on a seasonally adjusted basis, after increasing 0.1 percent in December, the U.S. Bureau of Labor Statistics reported today. Over the last 12 months, the all items index increased 6.4 percent before seasonal adjustment. The index for shelter was by far the largest contributor to the monthly all items increase, accounting for nearly half of the monthly all items increase, with the indexes for food, gasoline, and natural gas also contributing. The food index increased 0.5 percent over the month with the food at home index rising 0.4 percent. The energy index increased 2.0 percent over the month as all major energy component indexes rose over the month.”
On an annual (non-adjusted) basis, inflation fell from 6.45% to 6.41%.
Despite the Commissioner blaming the rise on shelter costs, just about everything was up drastically. Food was up 10.1% over the year ½% in January alone. Fuel oil was up 27.7% over the year, although down -1.2% in January. Shelter was up 7.9% over the year and 0.7% for January alone. Utility Piped Gas was up a whopping 6.7% over the month and 26.7% for the year. The ONLY bright spot was Used Cars and trucks, which were down -11.6% for the year and -1.9% for the month. Conversely, new vehicles were up 5.8% for the year.
Monthly Inflation Compared to Previous Years:
In the chart below, we can see how the monthly inflation compares between 2019 (light green), 2020 (light blue), 2021 (pink), 2022 (red), and 2023 (orange). We can see that virtually every month in 2021 was above the corresponding month in 2020, but in 2022, April and July-December were below 2021’s level. January 2023 was just slightly below January 2022.
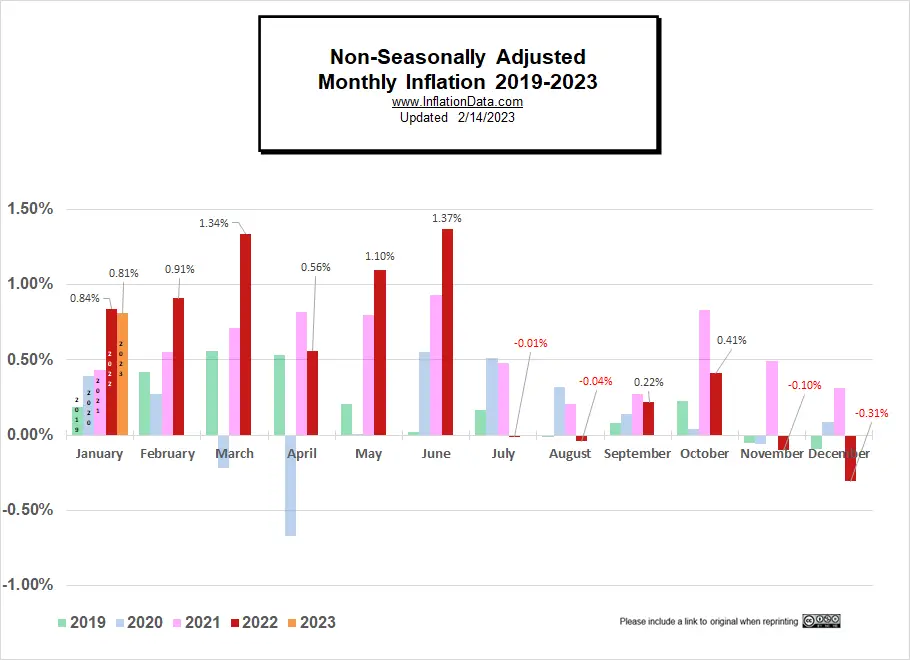
Not Seasonally Adjusted Monthly Inflation Rates
Note: January 2022’s 0.84% was the highest January since 1990. June was the highest June since 1941 (although the first quarter of 1980 had some higher rates). Typically, June is the beginning of lower monthly rates.
| Jan | Feb | Mar | Apr | May | Jun | Jul | Aug | Sep | Oct | Nov | Dec | |
| 2016 | 0.17% | 0.08% | 0.43% | 0.47% | 0.41% | 0.33% | (0.16%) | 0.09% | 0.24% | 0.12% | (0.16%) | 0.03% |
| 2017 | 0.58% | 0.31% | 0.08% | 0.30% | 0.09% | 0.09% | (0.07%) | 0.30% | 0.53% | (0.06%) | 0.002% | (0.06%) |
| 2018 | 0.54% | 0.45% | 0.23% | 0.40% | 0.42% | 0.16% | 0.01% | 0.06% | 0.12% | 0.18% | (0.33%) | (0.32%) |
| 2019 | 0.19% | 0.42% | 0.56% | 0.53% | 0.21% | 0.02% | 0.17% | (0.01%) | 0.08% | 0.23% | (0.05%) | (0.09%) |
| 2020 | 0.39% | 0.27% | (0.22%) | (0.67%) | 0.002% | 0.55% | 0.51% | 0.32% | 0.14% | 0.04% | (0.06%) | 0.09% |
| 2021 | 0.43% | 0.55% | 0.71% | 0.82% | 0.80% | 0.93% | 0.48% | 0.21% | 0.27% | 0.83% | 0.49% | 0.31% |
| 2022 | 0.84% | 0.91% | 1.34% | 0.56% | 1.10% | 1.37% | (0.01%) | (0.04%) | 0.22% | 0.41% | (0.10%) | (0.34%) |
| 2023 | 0.80% |
See: Monthly Inflation Rate for more information and a complete table of Unadjusted Monthly Rates.
Inflation Forecast
Looking back at the chart we created last February (a year ago), although there was a wide range of possibilities at that point, the actual line has come surprisingly close to our “most likely” projection.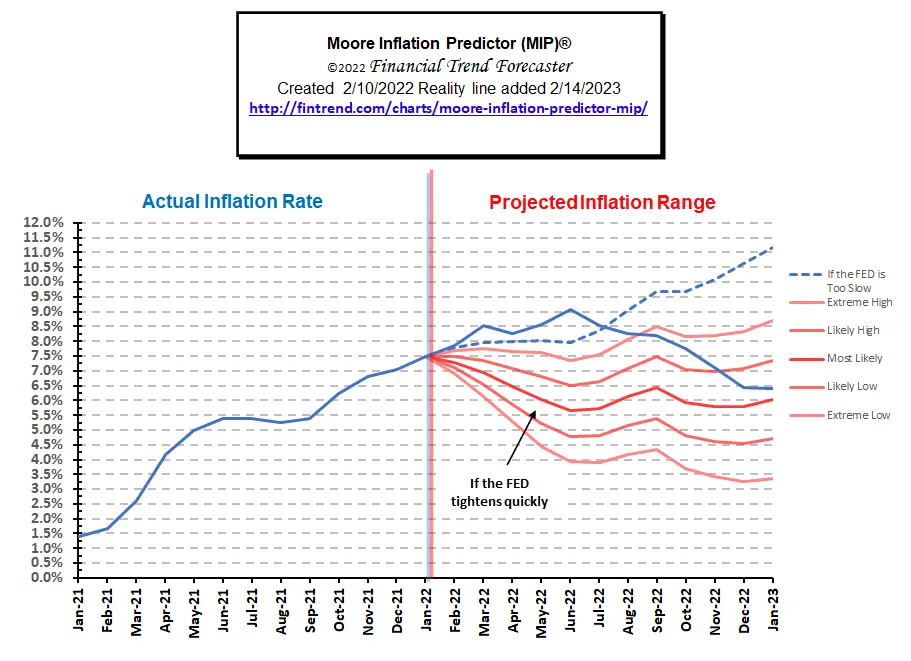
See this month’s full MIP Chart and commentary here.
NYSE & NASDAQ ROC – Generated a Buy Signal!
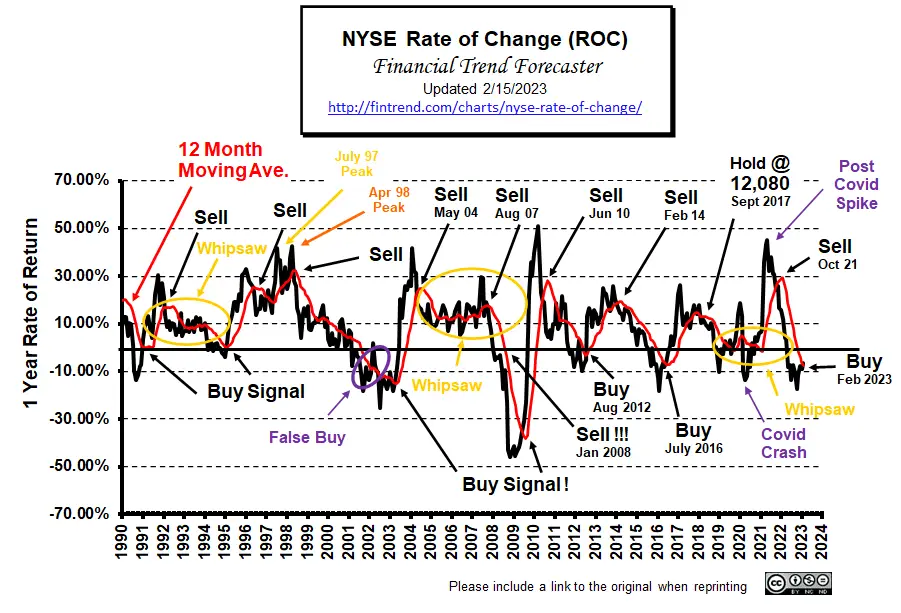
For more info, See NYSE ROC and NASDAQ ROC for more.
Misery Index
Unemployment and Inflation were down.
[Read More on the Misery Index…]
Inflation-adjusted Oil Price Chart and Oil Price Table
We’ve also updated the Inflation adjusted Oil Price Chart and Oil Price Table
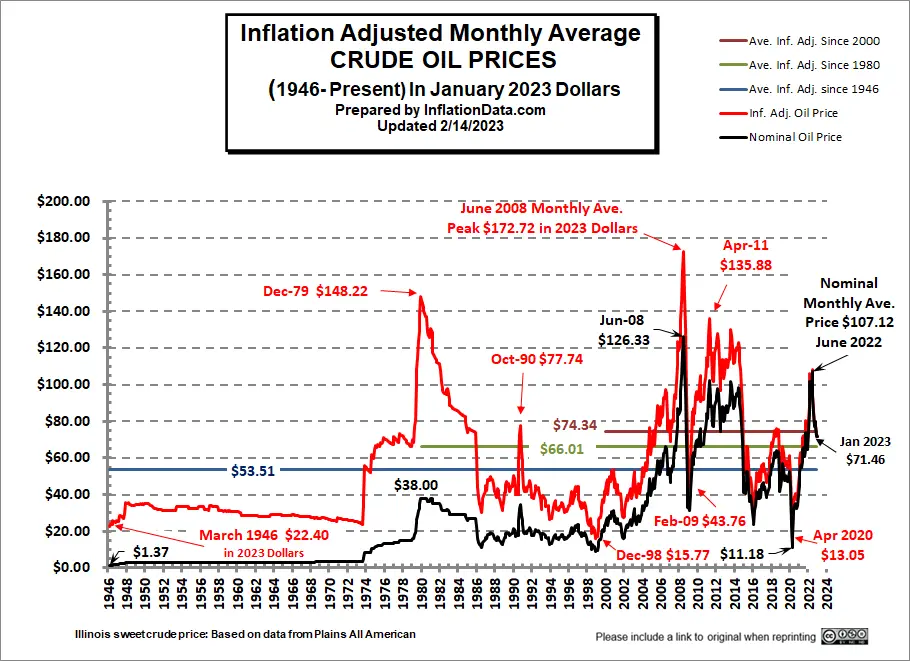
Read the full commentary here: Inflation-adjusted Crude Oil Chart and here Inflation-Adjusted Oil Prices in Table Form
You Might Also Like:
From InflationData.com
- Is The Fed Flashing Signs It’s Done Raising Rates?
- Falling Inflation is Good for Stocks
- Why the Fed Is Bankrupt and Why That Means More Inflation
From Financial Trend Forecaster
- NYSE ROC Chart
- NASDAQ ROC Chart
- Has the Stock Market Turned Positive?
- Are Countries Getting Smaller?
- Is the U.S. Dollar Hegemony Ending?
- Latest Recession Alarm
- Housing Is Getting Less Affordable
- Will Loan Forgiveness Raise College Costs?
- Is The U.S. A Powerful “Empire” In Decline?
From UnemploymentData.com.
- Strategies for Conquering Job Search Frustration
- January Employment / Unemployment Report
- December 2022- Employment and Unemployment by State
- 5 Career Opportunities for Disabled Individuals
From Elliott Wave University
- 60% stocks, 40% bonds? Ha!
- U.S. Dollar: Has the Mainstream Been Way Too Confident?
- Banks Are Becoming More Cautious About Lending
- Are You Prepared for Widespread Bank Failures?
- Will Another “Great Depression” Start in Europe?
From OptioMoney
- 6 Ways to Cope with Bad Financial Decisions
- Simple Ways to Save Money When Shopping Online
- How to Start Saving for Your Education
- 5 Tips for Paying Off Your Debt
From Your Family Finances
- What You Should Know Before Taking Out a Home Loan
- Recovering Financially After Addiction
- 5 Strategies for Managing Wealth in Your 30s
- Why You Should Open a Checking Account for Your Child
- Quick Health Insurance Tips

Leave a Reply