
Historical Gasoline Prices in Pictures–
I thought it would be fun to look at some pictures of gasoline prices in days gone by. Of course, we have to remember that salaries were much lower in those days as well. Inflation doesn’t affect all prices equally. Let’s look at how Gasoline Prices and Wages relate since the 1920s.

In 1924 my grandfather probably paid around 21 cents a gallon for gasoline. The average wage was about 62.6¢/hour. But that was just the average, a unionized carpenter in Boston would have made a whole Dollar an hour.
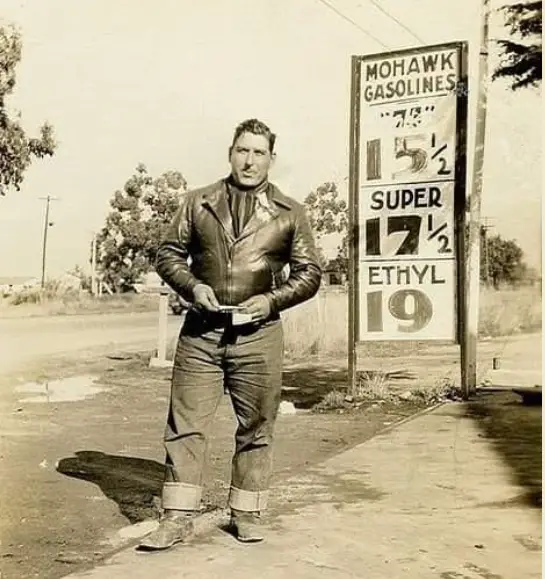
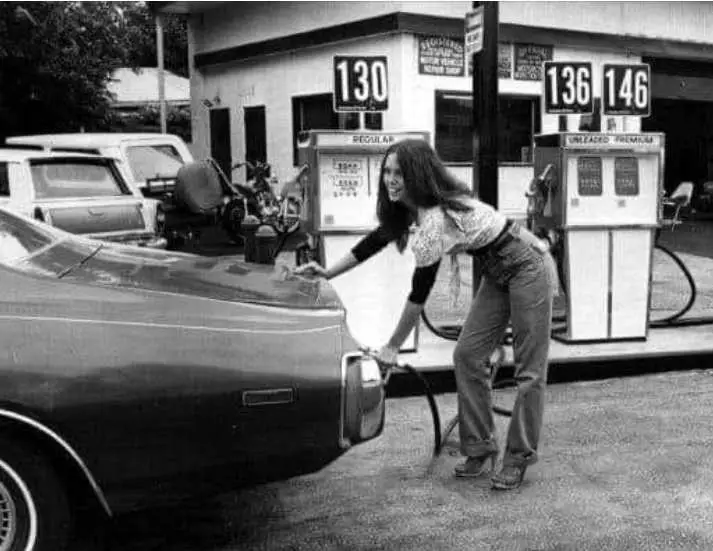
Imagine paying 15½ cents for a gallon of gasoline. Although we don’t have an exact date for these pictures, we can estimate the dates based on the prices. The only time gasoline prices were anywhere near this low was in the 1930s. In 1920 gasoline was 30¢/gallon… from there, it steadily fell to 21¢/gallon in 1929. The lowest recorded average annual gasoline price was 17¢/gallon in 1931. But that was the average for the whole year, over the whole country, and obviously, somewhere, the price was only 15½ cents a gallon.
Gasoline Prices and Wages in the 1930s
The average wage for a “common laborer” in 1931 was 41.2¢ per hour, but on the low end, some only made 10¢ per hour, meaning the lowest paid laborer would have to work an hour and a half to get 1 gallon of gasoline. But then again, in those days, the lowest-paid laborers wouldn’t have anything to put gas in, since they couldn’t afford a car either.
At 17¢/gallon, the average laborer would have to work just under 25 minutes to buy a gallon of gasoline. By 1932, depression era average wages had fallen to 38.1¢ per hour, and the low had fallen to 5¢ per hour, and people were glad they had a job. But gasoline prices had actually risen to 18¢/gallon. So now, the average worker had to work over 28 minutes to buy one gallon of gas. And by 1932, the average wage had fallen to 35¢/hr. and once again, the price of gas had not fallen, so now the average worker had to work over a half hour just to buy one gallon of gas.
Note: Federal minimum wage laws were not instituted until 1938, at which point they were 25¢/hr.
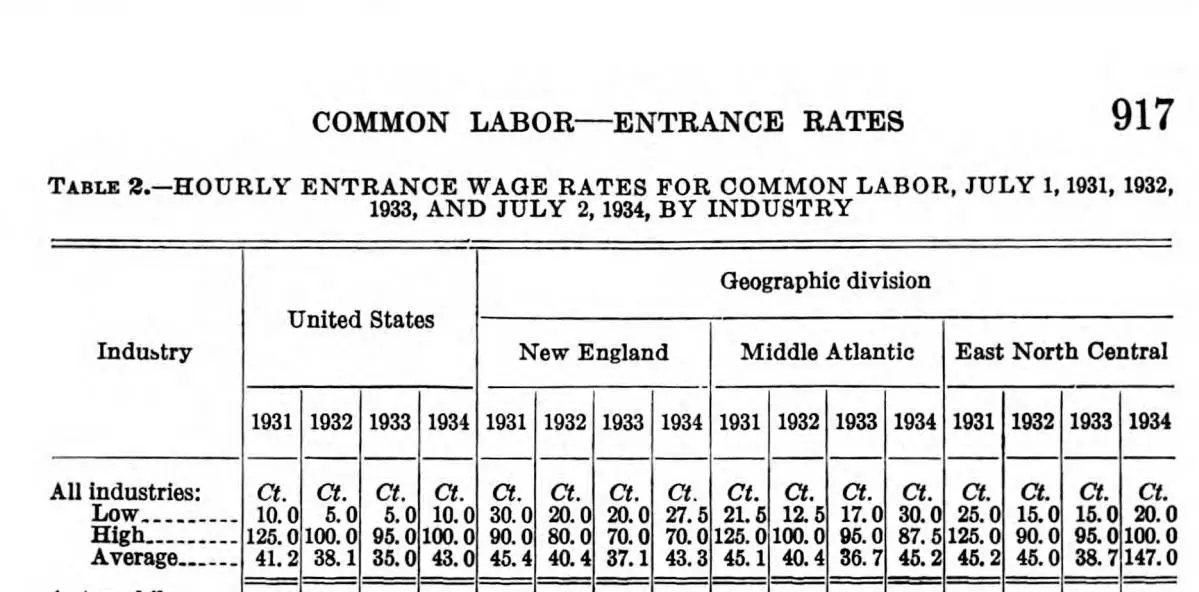
Click for Larger Image
See: Full Table
Prices and Wages by Decade: 1930-1939
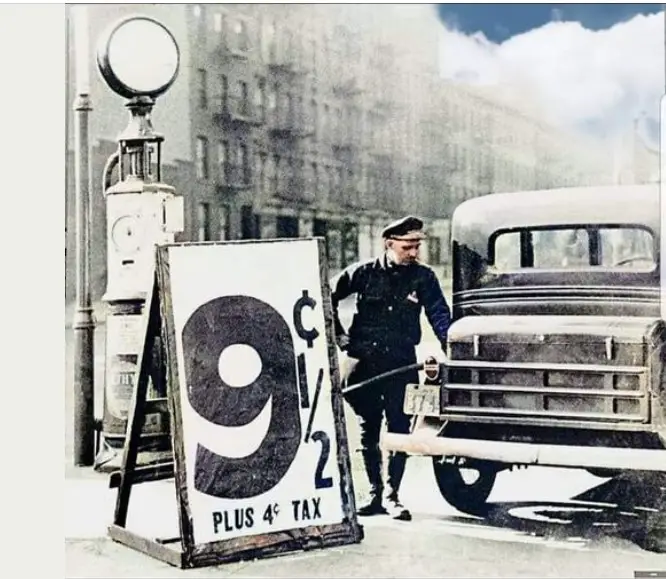
Here we see gasoline prices that appear to be even lower than the record low of 1931. So how can that be? First of all, the price of 17¢/gallon was an annual nationwide average which means that at various times and in various locations, prices would be lower.
But also note that this 9½¢ is a bit of creative marketing. The “fine print” says that there is 4 cents tax on top of the 9½¢ price. And we thought our tax rates were high. That is a 42% tax on that gasoline, and the total price per gallon was 13½¢/gallon.
Later on, the government would outlaw this type of pricing and require that the posted price include taxes (perhaps so people wouldn’t know how badly the government was gouging them). So you can’t really blame the businesses for wanting the public to know the truth about where the money was actually going.
Interestingly, all other prices (besides gasoline) are quoted before sales tax is added. According to Happy Wayfarer, “In some states, the Law explicitly requires that price tags do not include sales tax. In Washington, it was illegal to advertise prices inclusive of sales tax until 2012. Still, Washington imposes certain conditions on the ways retailers can advertise such prices.”
Gasoline Prices and Wages in the 1950s
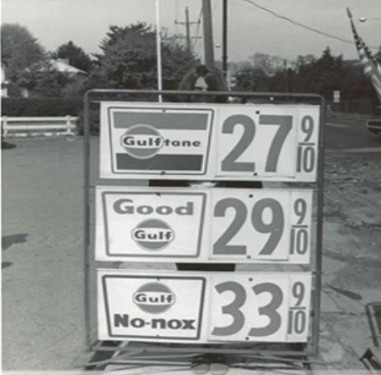
By 1950 the average price of gasoline had increased to 27¢/gallon. The average annual income was only $2000/year or $38/week, so it was less than $1/hour. So a gallon of gasoline would cost the average worker about 17 minutes of labor. In January of 1950, the Federal minimum wage was raised to 75¢/hr. so a minimum wage worker would take 21.6 minutes to earn a gallon of gasoline.
Gasoline Prices and Wages in the 1980s
Throughout the 1970s, gasoline had steadily climbed from 36¢/gallon in 1970 to 88¢/gallon in 1979. And for the first time in the history of the U.S., gasoline costs more than $1.00 in 1980. It actually averaged $1.22/gallon in 1980 and $1.35 in 1981.
The average annual wage in 1981, was $15,432 in “private industry,” or about $7.42/hour, so despite the massive run-up in the price of gas, the average worker only had to work less than 10 minutes to buy a gallon of gas. In January of 1980, the minimum wage was raised to $3.10/hr from $2.90, and then in January of 1981, it was raised again to $3.35. So, in 1981, a minimum-wage worker would have to work just under 24 minutes to earn a gallon of gasoline.
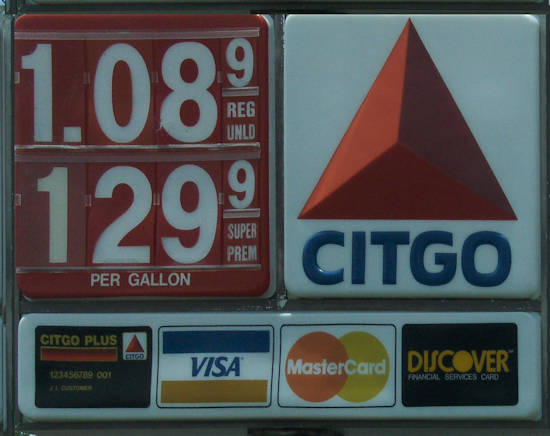
Gasoline Prices and Wages in the 1990s
The 1990s were good times for the price of gasoline, prices were stable and relatively low. They began the decade at $1.12/gallon in 1990 and ended the decade at $1.12/gallon in 1999. In between, annual averages got as high as $1.19 in 1997 and as low as $1.02 in 1998. Gasoline prices averaged $1.09 in 1992 and $1.07 in 1993 and 1994. According to the U.S. Bureau of Labor Statistics, the average annual pay of all workers covered by State and Federal Unemployment Insurance programs was $25,903 in 1992, a 5.4 percent increase over 1991.
 So in 1992, the average worker earned about $12.45 an hour. Therefore it only took a little over 5 minutes of work to buy a gallon of gas for the average wage earner in 1992. The federal minimum wage was raised to $4.25 in April of 1991. So a minimum wage earner would take only take a little over 15 minutes to earn a gallon of gas.
Gasoline Prices and Wages in the 2000s
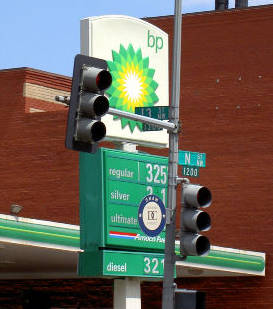 Gasoline prices rose rapidly in the new millennium, jumping to $1.46 in 2000 and then to $1.81 in 2004. In 2008 gas prices first broke above $3.00/gallon, averaging $3.22 for the year.
According to the Bureau of Labor Statistics, individuals earned an average of $15.57 per hour or $32,390 per year in 2008. So, at $3.22 per gallon the average individual in the U.S. would have to work 12.4 minutes to buy a gallon of gas.
In July of 2008, the minimum wage was raised to $6.55. so the average minimum wage worker would have to work almost a half hour to buy a gallon of gas.
Adjustments to Our Calculations
We have to remember that the average worker would actually have to work longer than the stated times due to taxes, Social Security, etc., being taken from their wages. On the other hand, minimum wage workers would probably fare slightly better than the average since they probably wouldn’t owe income taxes. But they wouldn’t receive other benefits like employer contributions for old-age, survivors, and disability insurance; health insurance; unemployment insurance; workers’ compensation; and private pensions. All of these benefits are not considered as part of the average wage so modern workers actually earn more than the stated wage, while earlier workers did not receive these benefits. Also, the 1931 wage data only included laborers, other professions would have earned higher wages but the vast majority of workers were either laborers or farmers. Modern data includes a wider range of professions.
Gasoline Prices and Wages in 2019
The average cost of Gasoline in 2019 was $2.50/gallon. The average income of all professions in 2019 was $27.86. The minimum wage was $7.25, and had been since 2009. So the average worker only had to work 5.83 minutes to buy a gallon of gas. The minimum wage worker had to work 20.68 minutes to buy a gallon of gas.
Gasoline Prices and Wages in 2022
The average cost of Gasoline in 2022 was $3.80/gallon. The average income of all professions was $29.76. The minimum wage was still $7.25. The average worker had to work slightly longer at 8.86 minutes to buy a gallon of gas. The minimum wage worker had to work 31.45 minutes to buy a gallon of gas.
Note: The Bureau of Labor Statistics reports that only 1.4% of the American workforce earned the minimum wage (or less) in 2021. In contrast, 13.4 percent earned the minimum in 1979 when this statistic first began being tracked.
Comparison Table
| Date | Cost per Gallon# | Average Wage per hour |
Minutes per Gallon Average Worker |
Minimum Wage per hour** |
Minutes per Gallon Minimum Wage Worker |
| 1924 | 21¢ | 62.6¢ | 20.13 | –* | — |
| 1931 | 17¢ | 41.2¢ | 24.75 | 10¢* | 102 |
| 1950 | 27¢ | 95¢ | 17.05 | 75¢ | 21.6 |
| 1981 | $1.22 | $7.42 | 9.87 | $3.10 | 23.61 |
| 1992 | $1.09 | $12.45 | 5.25 | $4.25 | 15.39 |
| 2008 | $3.22 | $15.57 | 12.41 | $6.55 | 29.50 |
| 2019 | $2.50 | $25.72 | 5.83 | $7.25 | 20.68 |
| 2022 | $3.80 | $29.76 | 7.66 | $7.25*** | 31.45 |
| June 2023 | $3.56 | $29.76## | 7.18 | $7.25*** | 29.46 |
*No Federal Minimum Wage – Lowest Wage Earned
** Individual States may have higher Minimum Wages. Washington State has the nation’s highest minimum wage, at $15.74 as of the start of 2023.
***The Bureau of Labor Statistics reports that hourly paid workers earning the federal minimum wage (or less) only made up 1.4% of the American workforce in 2021.
# National and Annual Average- Individual States and times may be higher or lower.
## Most recent data available- BLS has not released any new data yet.
To see an in-depth view of the inflationary makeup of each decade:
|1913-19 | 1920-29 | 1930-39 | 1940-49 | 1950-59 | 1960-69 | 1970-79 | 1980-89 | 1990-1999 |
You might also like:
Leave a Reply