Every so often I get a reader who writes a comment accusing me (although the numbers actually come from the Bureau of Labor Statistics) of underestimating the actual inflation rate. He reasons that, since his favorite bread cost $3.00 last year and now it costs $3.50… how can inflation possibly be only 2%? Typically my answer has been that individual items can change but actually cancel each other out. Such as in February 2015 when things like “meat, poultry, fish and eggs” increased 7.6% but energy prices fell enough to make the overall CPI slightly less than zero (i.e. deflationary). But this month we actually see evidence of another explanation.
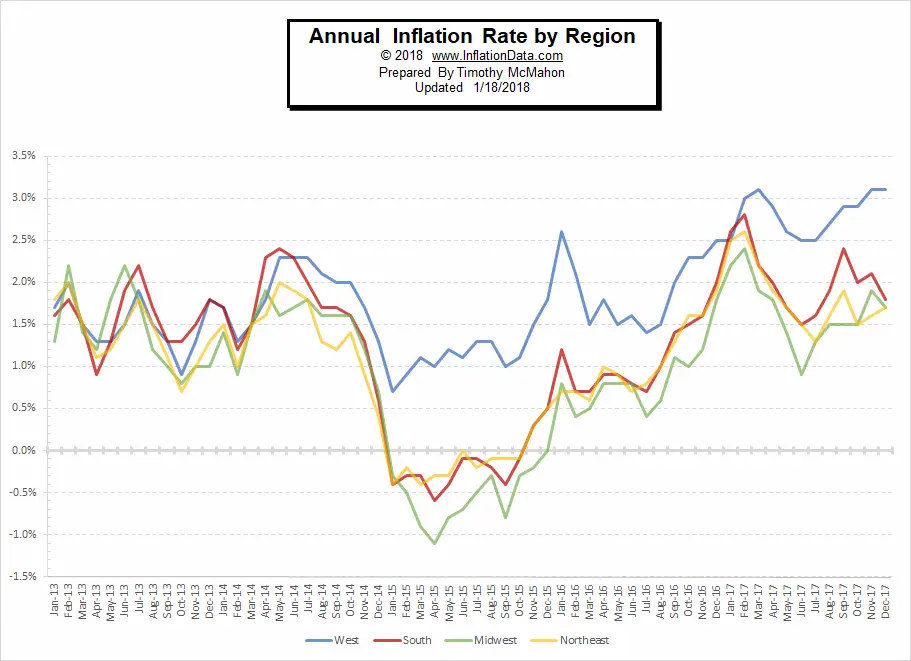
Annual Inflation for the year ending in December 2017 was 2.11% as we reported here. But remember that is actually the average for the entire country. If you look at it region by region you will get an entirely different picture. According to the regional data presented by the U.S. Bureau of Labor Statistics (BLS) Inflation varied quite a bit from region to region. Regions like the Midwest (and surprisingly the Northeast) had inflation lower than average at 1.7% while the South was 1.8% and the West was much higher than average at 3.1%. But even within regions there were variations with Seattle having 3.5% inflation and the Los Angeles area having inflation of 3.6% while San Francisco had “only” 2.9%.
 As we can see from the above chart, way back in January of 2015 prices did not fall as much in the Western region as in other regions and since then inflation has picked up more than in other regions. Part of the inflationary pressure in California is coming from Real Estate prices rising faster than average due in part to a faster than average rising population. Unemployment in Western states like North Dakota at 2.6%, Colorado and Idaho both at 2.9% and Utah at 3.2% add inflationary pressure due to a low unemployment rate which according to the Phillips Curve adds inflationary pressure to the local economy. Some economists are saying that California has had “strong jobs growth” as well but their unemployment rate is still among the highest one-third out of all states at 4.6% and well above the national average of 4.1%. Which lends credence to a recent study done by the St. Louis Fed regarding the low correlation of the Phillips Curve to observed results. According to St. Louis Fed President James Bullard “It is not as much correlation as you would think.”
You might also like:
- What Is the Real Inflation Rate?
- Deflation February 2015 Almost Zero
- What is the Phillips Curve?
- December 2017 Inflation Report
- Its Weight in Gold: The Real Prices of Things
- The Real Basket of Goods
- Food Price Inflation Since 1913
- Cost of Living: How Much of Your Budget Goes to Food?


Leave a Reply