• Home
  • Related Sites
    • Financial Trend Forecaster
      • Moore Inflation Predictor
      • NYSE Rate of Change (ROC)
      • NASDAQ Rate of Change (ROC)
      • Crypto ROC- BTC & ETH
    • Unemployment Data
      • Historical Employment Data
      • Unemployment Rate Chart
      • Labor Force Participation Rate
    • Optio Money
    • Elliott Wave University
    • More Resources
  • Definitions
    • What is Inflation?
    • What is Core Inflation?
    • Inflation vs CPI
    • What is Deflation?
    • What is Disinflation?
    • What is Agflation?
    • What is Stagflation?
    • What is Hyperinflation?
    • What is Quantitative Easing?
    • What is Quantitative Tightening?
    • What is Velocity of Money?
    • What is Fiat Currency?
    • How Do I Calculate Inflation?
    • What are “Sticky Prices” and Why Do They Matter?
  • Featured Content
  • About Us
  • Feedback
    • Sitemap
  • Subscribe Now

InflationData.com

Your Place in Cyber Space for Inflation Data

CPI Index

CPIWidgetSept25
  • Numerical Inflation Data
    • Current Inflation Rate
    • Monthly Inflation Rate
    • Historical U.S. Inflation Rates
    • Historical CPI
  • Inflation Charts
    • Ann. Inf. Rate Chart
    • Long Term Inflation >
      • Ave. Inf. by Decade
      • Total Inf. by Decade
      • Inflation 1913-1919
      • Inflation 1920-1929
      • Inflation 1930-1939
      • Inflation 1940-1949
      • Inflation 1950-1959
      • Inflation 1960-1969
      • Inflation 1970-1979
    • Cumulative Inflation
    • FED Monetary Policy and Inflation
    • Inflation and Recession
    • Confederate Inflation (1861 – 1865)
    • Misery Index
    • The 3 Stages of Inflation
    • 15-Yr Inflation Trends Chart
  • Inflation Calculators
    • Cumulative Inf. Calc.
    • How Much Would it Cost
    • Salary Inf. Calc.
    • Cost of Living Calc.
    • U.K. Inf. Calc.
    • Cost of Gas Calc.
    • Net Worth Calc.
    • Lifetime Earnings Calc.
    • Savings Goal Calc.
    • Financial Calculators
  • Inf. Adjusted Prices
    • Energy >
      • Inflation Adj. Gas Prices
      • Historical Oil Prices Chart
      • Crude Oil Price (Table)
      • Natural Gas Prices
      • Electricity Prices
      • Oil vs Gold
    • Gold >
      • Inflation Adjusted Annual Average Gold Prices
      • Gold is a “Crisis Hedge” not an  “Inflation Hedge”
      • Comparing Oil vs. Gold
    • Corn Prices
    • Education Inflation
    • Housing Prices
    • Mortgage Rates
    • NYSE Index
    • Inf. Indexed Bonds
    • Movie Revenues
    • Inflation-Adjusted Wages
  • Cost of Living
    • Calculate Cost of Living
    • Cost-of-living Adj. (COLA)
    • Consumer Price Index CPI
      • Historical CPI
      • Current CPI
      • CPI Release Dates
    • Gas Prices >
      • Cost of Gas
      • Cost of Gas Per Month
      • Gas vs. Oil Price Chart
    • Food Prices 1913 vs 2013
    • Health Insurance
  • Blog
    • Key Inflation Articles
    • International Inflation
    • Historical Inflation Rates for Japan (1971 to 2014)
You are here: Home » Blog » Inflation » Annual Inflation Rates Not Uniform Throughout the Country

Annual Inflation Rates Not Uniform Throughout the Country

Published on January 18, 2018 by Tim McMahon Leave a Comment

Every so often I get a reader who writes a comment accusing me (although the numbers actually come from the Bureau of Labor Statistics) of underestimating the actual inflation rate. He reasons that, since his favorite bread cost $3.00 last year and now it costs $3.50… how can inflation possibly be only 2%? Typically my answer has been that individual items can change but actually cancel each other out.  Such as in February 2015 when things like “meat, poultry, fish and eggs” increased 7.6% but energy prices fell enough to make the overall CPI slightly less than zero (i.e. deflationary). But this month we actually see evidence of another explanation.

Annual Inflation for the year ending in December 2017 was 2.11% as we reported here. But remember that is actually the average for the entire country. If you look at it region by region you will get an entirely different picture. According to the regional data presented by the U.S. Bureau of Labor Statistics (BLS) Inflation varied quite a bit from region to region. Regions like the Midwest (and surprisingly the Northeast) had inflation lower than average at 1.7% while the South was 1.8% and the West was much higher than average at 3.1%. But even within regions there were variations with Seattle having 3.5% inflation and the Los Angeles area having inflation of 3.6% while San Francisco had “only” 2.9%.


Inflation by region
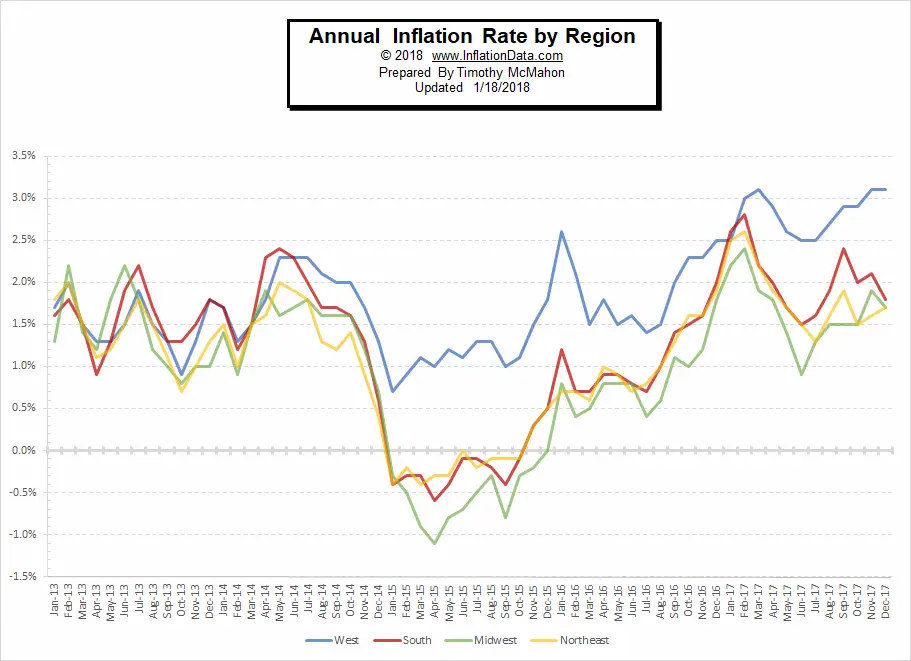
As we can see from the above chart, way back in January of 2015 prices did not fall as much in the Western region as in other regions and since then inflation has picked up more than in other regions. Part of the inflationary pressure in California is coming from Real Estate prices rising faster than average due in part to a faster than average rising population. Unemployment in Western states like North Dakota at 2.6%, Colorado and Idaho both at 2.9% and Utah at 3.2% add inflationary pressure due to a low unemployment rate which according to the Phillips Curve adds inflationary pressure to the local economy. Some economists are saying that California has had “strong jobs growth” as well but their unemployment rate is still among the highest one-third out of all states at 4.6% and well above the national average of 4.1%. Which lends credence to a recent study done by the St. Louis Fed regarding the low correlation of the Phillips Curve to observed results. According to St. Louis Fed President James Bullard “It is not as much correlation as you would think.”

You might also like:

  • What Is the Real Inflation Rate?
  • Deflation February 2015 Almost Zero
  • What is the Phillips Curve?
  • December 2017 Inflation Report
  • Its Weight in Gold: The Real Prices of Things
  • The Real Basket of Goods
  • Food Price Inflation Since 1913
  • Cost of Living: How Much of Your Budget Goes to Food?

About Tim McMahon

Connect with Tim on Google+.

  • Web
  • |
  • Twitter
  • |
  • Facebook
  • |
  • LinkedIn
  • |
  • More Posts(404)

Filed Under: Inflation Tagged With: Bread, inflation, Los Angeles, Region, States, Uniform

Leave a Reply Cancel reply

Your email address will not be published. Required fields are marked *

This site uses Akismet to reduce spam. Learn how your comment data is processed.

Latest Posts

  • How Deflation Created the Middle Class
  • October Inflation Numbers Delayed
  • Why the 2.8% COLA May Fall Short of Real Inflation
  • Delayed BLS September Inflation Data Released
  • September CPI Data Delay Causes Social Security COLA Concerns
  • August 2025 Inflation Report
  • Is the FED Getting Soft on Inflation?
  • July Inflation Report

Sponsored:

As a Seasoned Investor I thought I'd seen everything... But recently I discovered TradingView which has really improved the information I have at my fingertips.~ Tim McMahon, editor

TradingView gives me an edge... including powerful charting tools, real-time market data, and a global community of traders—all in one easy to use platform. It has hundreds of indicators, and even custom scripts for more advanced users, and you don't need to change Brokers just use its seamless brokerage integration... TradingView isn't just a charting tool—it's your full trading command center.

Trade smarter. Trade faster. Check Out TradingView for free.

----------

The Best Place to Buy Your Crypto

Coinbase is the largest Crypto Trading platform in the U.S. and the easiest to use. ~Tim McMahon, editor

Check out Coinbase here

Subscribe Now

eTrends Signup Form

Elliott Wave Resources

Free Elliott Wave Resources

What is Waveopedia?

Waveopedia is EWI’s free, comprehensive index of Elliott wave patterns and terms. Everyone from beginners to experts can benefit from it. It’s a great place to send your followers if they’re new to Elliott waves.

  • Deflation Hits China is the U.S. Next?

  • Why You Must Avoid the Herding Trap

  • Chasing Trends Can Cost You

  • More Education Resources

Post Archives

Home | Articles | Sitemap | Terms of Service | Privacy | Disclaimer | Advertise With Us

Copyright © 1996-2025 · Capital Professional Services, LLC · Maintained by Design Synergy Studio · Admin

Do Not Sell My Personal Information