• Home
  • Related Sites
    • Financial Trend Forecaster
      • Moore Inflation Predictor
      • NYSE Rate of Change (ROC)
      • NASDAQ Rate of Change (ROC)
      • Crypto ROC- BTC & ETH
    • Unemployment Data
      • Historical Employment Data
      • Unemployment Rate Chart
      • Labor Force Participation Rate
    • Optio Money
    • Elliott Wave University
    • More Resources
  • Definitions
    • What is Inflation?
    • What is Core Inflation?
    • Inflation vs CPI
    • What is Deflation?
    • What is Disinflation?
    • What is Agflation?
    • What is Stagflation?
    • What is Hyperinflation?
    • What is Quantitative Easing?
    • What is Quantitative Tightening?
    • What is Velocity of Money?
    • What is Fiat Currency?
    • How Do I Calculate Inflation?
    • What are “Sticky Prices” and Why Do They Matter?
  • Featured Content
  • About Us
  • Feedback
    • Sitemap
  • Subscribe Now

InflationData.com

Your Place in Cyber Space for Inflation Data

CPI Index

CPIWidgetSept25
  • Numerical Inflation Data
    • Current Inflation Rate
    • Monthly Inflation Rate
    • Historical U.S. Inflation Rates
    • Historical CPI
  • Inflation Charts
    • Ann. Inf. Rate Chart
    • Long Term Inflation >
      • Ave. Inf. by Decade
      • Total Inf. by Decade
      • Inflation 1913-1919
      • Inflation 1920-1929
      • Inflation 1930-1939
      • Inflation 1940-1949
      • Inflation 1950-1959
      • Inflation 1960-1969
      • Inflation 1970-1979
    • Cumulative Inflation
    • FED Monetary Policy and Inflation
    • Inflation and Recession
    • Confederate Inflation (1861 – 1865)
    • Misery Index
    • The 3 Stages of Inflation
    • 15-Yr Inflation Trends Chart
  • Inflation Calculators
    • Cumulative Inf. Calc.
    • How Much Would it Cost
    • Salary Inf. Calc.
    • Cost of Living Calc.
    • U.K. Inf. Calc.
    • Cost of Gas Calc.
    • Net Worth Calc.
    • Lifetime Earnings Calc.
    • Savings Goal Calc.
    • Financial Calculators
  • Inf. Adjusted Prices
    • Energy >
      • Inflation Adj. Gas Prices
      • Historical Oil Prices Chart
      • Crude Oil Price (Table)
      • Natural Gas Prices
      • Electricity Prices
      • Oil vs Gold
    • Gold >
      • Inflation Adjusted Annual Average Gold Prices
      • Gold is a “Crisis Hedge” not an  “Inflation Hedge”
      • Comparing Oil vs. Gold
    • Corn Prices
    • Education Inflation
    • Housing Prices
    • Mortgage Rates
    • NYSE Index
    • Inf. Indexed Bonds
    • Movie Revenues
    • Inflation-Adjusted Wages
  • Cost of Living
    • Calculate Cost of Living
    • Cost-of-living Adj. (COLA)
    • Consumer Price Index CPI
      • Historical CPI
      • Current CPI
      • CPI Release Dates
    • Gas Prices >
      • Cost of Gas
      • Cost of Gas Per Month
      • Gas vs. Oil Price Chart
    • Food Prices 1913 vs 2013
    • Health Insurance
  • Blog
    • Key Inflation Articles
    • International Inflation
    • Historical Inflation Rates for Japan (1971 to 2014)
You are here: Home » Blog » Inflation » Deflation » Europe in Deflation: Got (cheap) Milk?

Europe in Deflation: Got (cheap) Milk?

Published on October 30, 2015 by Elliott Wave International Leave a Comment

Why falling food prices are not a boon for Europe’s economy

By Elliott Wave International

In the early 1990s, two simple words from a genius ad campaign radically transformed the way the U.S. consumer saw it: “Got Milk?”

Suddenly, the narrative changed from an obligatory drink you had to finish as a kid, along with eating your vegetables — into a sexy, funny, and above all desirable treat for all ages.

Until now.

ID-100112601In Europe, in 2015, famous celebrities donning milk mustaches no longer light the public’s passion for lactose — as prices for milk have spoiled. Here, a September 8, 2015 CNN Money article captures the curdled state of affairs:

“So much milk is sloshing around the European Union that milk is often cheaper than bottled water. In UK, a liter bottle of water costs around $1.50, a liter of milk $1… Wholesale milk prices have collapsed by 20% this year.”

(Idea for a new campaign pitch: “Got (really, really, dirt cheap) Milk?”)

Except that, it’s not just the price of milk that’s gone sour. According to data from April 2015, “supermarket prices in the UK have fallen at the steepest rate in eight years,” including meat, milk, cheese, and vegetables. (The Telegraph)

There’s no disputing the decline is a disaster for dairy farmers and the like. But cheaper food costs — well, according to the mainstream financial experts — that’s a boon for consumers and commodity-dependent companies.

Affirms one October 12, 2015 USA Today article:

“The big drop in raw materials costs is going into somebody’s pocket… proving a rare opportunity to pocket savings but maintain retail prices and strong demand.”

This idea is nothing new. It gained mainstream traction back in 2014, when a 60% crash in crude oil prices inspired the “goodflation” movement. And in May 2015, when the UK’s Consumer Price Index plunged into negative territory for the first time in 55 years, the move was hailed as good news:

“This looks like the mild and benign variety of deflation… Instead we should welcome the positive effects that lower food and energy prices bring for households at a time when wages are rising strongly, unemployment is falling, and the economy is growing.” (May 19 Daily Mail)

But here’s the thing; we’ve crunched the numbers. We’ve checked and rechecked all the inventory. And the results couldn’t be clearer: Declining food and energy prices have not contributed to and/or secured rising wages, falling unemployment, or strong economic growth.

Here, the following chart from our September European Financial Forecast, puts this reality in stark focus:

“Play with the numbers however you like, but no amount of slicing and dicing can hide the fact that deflation has moved in, made itself comfortable and is now checking out what’s free to eat.”

Down Escalator

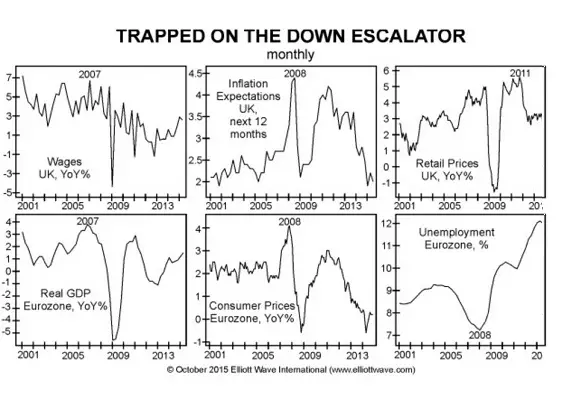
With the eurozone’s real GDP flat, unemployment rising, and wages in the UK at the same level where they were years ago, the evidence is clear: deflation has not been a “good thing” for Europe’s economy. In fact, much of the world is under deflation’s tightening grip. And judging by the magnitude of deflation spreading through Europe, and even the U.S., the vise will not rest on food and commodity prices alone.

The best part is, we’ve just compiled a special free three-part report on deflation including exclusive, subscriber-grade excerpts from our European Financial Forecast and Elliott Wave Financial Forecast — that will equip you with a long-term picture of the global deflationary changes in store.

Get the full picture of what we see as a worldwide deflationary trend in our new report, Deflation and the Devaluation Derby.

Here’s what you will learn:

  • Currency devaluation’s role in the developing global crisis
  • How the self-reinforcing aspect of deflation is already apparent in commodities trading
  • Why the top 1% of earners are in for a rude awakening
  • How Europe’s biggest economies are screeching to a halt
  • The hair-raising future for U.S. stocks

Just recall how swiftly the 2007-2009 financial crisis unfolded. We anticipate that the next global financial crisis could be even more sudden and severe.

Prepare now with our new report, Deflation and the Devaluation Derby. CLICK TO CONTINUE READING >>


This article was syndicated by Elliott Wave International and was originally published under the headline Europe in Deflation: Got (cheap) Milk?. EWI is the world’s largest market forecasting firm. Its staff of full-time analysts led by Chartered Market Technician Robert Prechter provides 24-hour-a-day market analysis to institutional and private investors around the world.

Image courtesy of Marin and freedigitalphotos.net

Filed Under: Deflation Tagged With: deflation, Europe, Milk

Leave a Reply Cancel reply

Your email address will not be published. Required fields are marked *

This site uses Akismet to reduce spam. Learn how your comment data is processed.

Latest Posts

  • How Deflation Created the Middle Class
  • October Inflation Numbers Delayed
  • Why the 2.8% COLA May Fall Short of Real Inflation
  • Delayed BLS September Inflation Data Released
  • September CPI Data Delay Causes Social Security COLA Concerns
  • August 2025 Inflation Report
  • Is the FED Getting Soft on Inflation?
  • July Inflation Report

Sponsored:

As a Seasoned Investor I thought I'd seen everything... But recently I discovered TradingView which has really improved the information I have at my fingertips.~ Tim McMahon, editor

TradingView gives me an edge... including powerful charting tools, real-time market data, and a global community of traders—all in one easy to use platform. It has hundreds of indicators, and even custom scripts for more advanced users, and you don't need to change Brokers just use its seamless brokerage integration... TradingView isn't just a charting tool—it's your full trading command center.

Trade smarter. Trade faster. Check Out TradingView for free.

----------

The Best Place to Buy Your Crypto

Coinbase is the largest Crypto Trading platform in the U.S. and the easiest to use. ~Tim McMahon, editor

Check out Coinbase here

Subscribe Now

eTrends Signup Form

Elliott Wave Resources

Free Elliott Wave Resources

What is Waveopedia?

Waveopedia is EWI’s free, comprehensive index of Elliott wave patterns and terms. Everyone from beginners to experts can benefit from it. It’s a great place to send your followers if they’re new to Elliott waves.

  • Deflation Hits China is the U.S. Next?

  • Why You Must Avoid the Herding Trap

  • Chasing Trends Can Cost You

  • More Education Resources

Post Archives

Home | Articles | Sitemap | Terms of Service | Privacy | Disclaimer | Advertise With Us

Copyright © 1996-2025 · Capital Professional Services, LLC · Maintained by Design Synergy Studio · Admin

Do Not Sell My Personal Information