• Home
  • Related Sites
    • Financial Trend Forecaster
      • Moore Inflation Predictor
      • NYSE Rate of Change (ROC)
      • NASDAQ Rate of Change (ROC)
      • Crypto ROC- BTC & ETH
    • Unemployment Data
      • Historical Employment Data
      • Unemployment Rate Chart
      • Labor Force Participation Rate
    • Optio Money
    • Elliott Wave University
    • More Resources
  • Definitions
    • What is Inflation?
    • What is Core Inflation?
    • Inflation vs CPI
    • What is Deflation?
    • What is Disinflation?
    • What is Agflation?
    • What is Stagflation?
    • What is Hyperinflation?
    • What is Quantitative Easing?
    • What is Quantitative Tightening?
    • What is Velocity of Money?
    • What is Fiat Currency?
    • How Do I Calculate Inflation?
    • What are “Sticky Prices” and Why Do They Matter?
  • Featured Content
  • About Us
  • Feedback
    • Sitemap
  • Subscribe Now

InflationData.com

Your Place in Cyber Space for Inflation Data

CPI Index

CPIWidgetSept25
  • Numerical Inflation Data
    • Current Inflation Rate
    • Monthly Inflation Rate
    • Historical U.S. Inflation Rates
    • Historical CPI
  • Inflation Charts
    • Ann. Inf. Rate Chart
    • Long Term Inflation >
      • Ave. Inf. by Decade
      • Total Inf. by Decade
      • Inflation 1913-1919
      • Inflation 1920-1929
      • Inflation 1930-1939
      • Inflation 1940-1949
      • Inflation 1950-1959
      • Inflation 1960-1969
      • Inflation 1970-1979
    • Cumulative Inflation
    • FED Monetary Policy and Inflation
    • Inflation and Recession
    • Confederate Inflation (1861 – 1865)
    • Misery Index
    • The 3 Stages of Inflation
    • 15-Yr Inflation Trends Chart
  • Inflation Calculators
    • Cumulative Inf. Calc.
    • How Much Would it Cost
    • Salary Inf. Calc.
    • Cost of Living Calc.
    • U.K. Inf. Calc.
    • Cost of Gas Calc.
    • Net Worth Calc.
    • Lifetime Earnings Calc.
    • Savings Goal Calc.
    • Financial Calculators
  • Inf. Adjusted Prices
    • Energy >
      • Inflation Adj. Gas Prices
      • Historical Oil Prices Chart
      • Crude Oil Price (Table)
      • Natural Gas Prices
      • Electricity Prices
      • Oil vs Gold
    • Gold >
      • Inflation Adjusted Annual Average Gold Prices
      • Gold is a “Crisis Hedge” not an  “Inflation Hedge”
      • Comparing Oil vs. Gold
    • Corn Prices
    • Education Inflation
    • Housing Prices
    • Mortgage Rates
    • NYSE Index
    • Inf. Indexed Bonds
    • Movie Revenues
    • Inflation-Adjusted Wages
  • Cost of Living
    • Calculate Cost of Living
    • Cost-of-living Adj. (COLA)
    • Consumer Price Index CPI
      • Historical CPI
      • Current CPI
      • CPI Release Dates
    • Gas Prices >
      • Cost of Gas
      • Cost of Gas Per Month
      • Gas vs. Oil Price Chart
    • Food Prices 1913 vs 2013
    • Health Insurance
  • Blog
    • Key Inflation Articles
    • International Inflation
    • Historical Inflation Rates for Japan (1971 to 2014)
You are here: Home » Blog » Government » The Federal Reserve » “No QE3″, Retracement Level Stalls Financials

“No QE3″, Retracement Level Stalls Financials

Published on February 17, 2012 Updated on June 2, 2021 by Chris Ciovacco Leave a Comment

Since financial stocks make up 14% of the S&P 500 Index, it is difficult to sustain a rally without strength in banks and financial services firms. With the Fed and ECB opening up the liquidity fire hydrant in late December 2011, bank stocks experienced another in a series of monster bailout rallies. As outlined below, the Financials Select Sector ETF (XLF) may be poised to give back some gains over the coming sessions based on numerous factors including reduced odds of QE3.

Unfortunately in the debt-saddled world we live in, central banks may be the most important driver of asset prices. Dallas Fed President Richard Fisher told reporters after a speech Wednesday:

There will be no QE3. I will support no QE3, no additional mortgage-backed securities, no additional Treasuries. Wall Street keeps dangling QE3 out there – I think it’s a fantasy of Wall Street – it’s not going to happen, it’s not necessary.

As we outlined in a January 16 video, the Fed, via currency swaps, and the ECB, via unlimited three-year loans, are already keeping the money printers busy. While there is no formal QE, the Fed is still injecting new money into the global financial system in a “QE-like” fashion (see How QE Boosts Stocks).

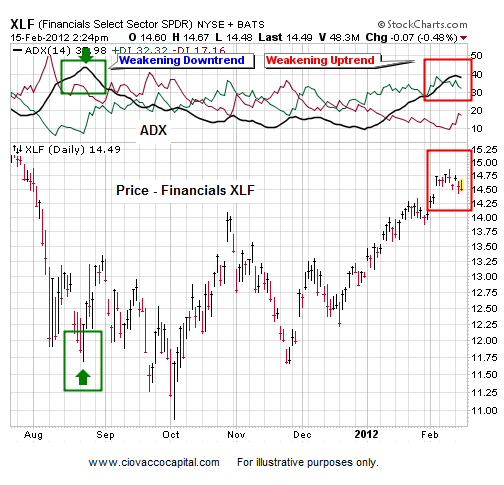
It is not unusual for markets to hesitate at key Fibonacci retracement levels, such as 61.8%. Therefore, the comments below will take on more meaning if the financials ETF shows signs of a reversal. A close below 14.42 would increase the odds of more sustained weakness. The 61.8% retracement of the losses from the spring high to October low sits at 14.61 (see right side of chart below). One more push toward 14.91 would fit well into an intermediate-term topping process; the same can be said for an S&P 500 move toward 1,363.

The chart of XLF below shows the ADX indicator at the top. When the black ADX line begins to roll over from high levels, it can be a warning of a possible trend reversal. On the left side of the chart (green arrows), ADX rolled over indicating the downtrend was losing steam – a sharp countertrend rally followed. We have the current ADX black line (red box top right) rolling over telling us to be open to a pullback in the financials.

No need to sound an alarm at this point, but holders of XLF, Bank of America (BAC), Wells Fargo (WFC), J.P. Morgan Chase (JPM), and U.S. Bancorp (USB) may want to keep a closer eye on things over the next week or so. These comments align well with our big picture concerns relative to a possible pullback outlined on February 10.

About Chris Ciovacco

  • Web
  • |
  • More Posts(12)

Filed Under: Economy, The Federal Reserve Tagged With: bank stocks, central banks, financial stocks, QE3

Leave a Reply Cancel reply

Your email address will not be published. Required fields are marked *

This site uses Akismet to reduce spam. Learn how your comment data is processed.

Latest Posts

  • How Deflation Created the Middle Class
  • October Inflation Numbers Delayed
  • Why the 2.8% COLA May Fall Short of Real Inflation
  • Delayed BLS September Inflation Data Released
  • September CPI Data Delay Causes Social Security COLA Concerns
  • August 2025 Inflation Report
  • Is the FED Getting Soft on Inflation?
  • July Inflation Report

Sponsored:

As a Seasoned Investor I thought I'd seen everything... But recently I discovered TradingView which has really improved the information I have at my fingertips.~ Tim McMahon, editor

TradingView gives me an edge... including powerful charting tools, real-time market data, and a global community of traders—all in one easy to use platform. It has hundreds of indicators, and even custom scripts for more advanced users, and you don't need to change Brokers just use its seamless brokerage integration... TradingView isn't just a charting tool—it's your full trading command center.

Trade smarter. Trade faster. Check Out TradingView for free.

----------

The Best Place to Buy Your Crypto

Coinbase is the largest Crypto Trading platform in the U.S. and the easiest to use. ~Tim McMahon, editor

Check out Coinbase here

Subscribe Now

eTrends Signup Form

Elliott Wave Resources

Free Elliott Wave Resources

What is Waveopedia?

Waveopedia is EWI’s free, comprehensive index of Elliott wave patterns and terms. Everyone from beginners to experts can benefit from it. It’s a great place to send your followers if they’re new to Elliott waves.

  • Deflation Hits China is the U.S. Next?

  • Why You Must Avoid the Herding Trap

  • Chasing Trends Can Cost You

  • More Education Resources

Post Archives

Home | Articles | Sitemap | Terms of Service | Privacy | Disclaimer | Advertise With Us

Copyright © 1996-2025 · Capital Professional Services, LLC · Maintained by Design Synergy Studio · Admin

Do Not Sell My Personal Information