By Tim McMahon
Back in 1924, John Maynard Keynes called gold a barbarous relic. There is a thought prevalent these days that deflation is the new barbarous relic.
In a speech in November of 2002, Federal Reserve chairman Ben Bernanke said, “I believe that the chance of significant deflation in the United States in the foreseeable future is extremely small… I am confident that the Fed would take whatever means necessary to prevent significant deflation… the effectiveness of anti-deflation policy could be significantly enhanced by cooperation between the monetary and fiscal authorities.” He went on to say, “the U.S. government has a technology, called a printing press (or, today, its electronic equivalent), that allows it to produce as many U.S. dollars as it wishes at essentially no cost.”
He also referred to “Milton Friedman’s famous helicopter drop of money” as a figurative method of fighting deflation, which earned him the nickname “helicopter Ben”.
His point was clear, the illustrious Chairman of the Federal Reserve says that deflation is unlikely… but a mere seven years later the country slipped into a deflationary scenario. Of course just as Bernanke predicted the Fed pulled out all the stops cranked up the printing presses, issued a trillion dollar “bailout” and several months later the country was back in inflationary territory. So perhaps Bernanke was right… deflation was short lived and simply the result of a drastic contraction of the money supply due to fear and rapidly falling stock prices.
However, if we look at two other factors you might see the case for deflation in a different light. The first factor is the velocity of money. In addition to the actual quantity of money available, there is a concept call “velocity”.
To understand the “velocity of money” you can look at a simple model understood by every small businessman. In business school they call it turn-over. The classic example of a high turnover business is a grocery store, especially the vegetable section. The average product in a grocery store sits on the shelf for a little over a week. Vegetables and fruits only last a few days, exotic packaged foods might last a couple of weeks but the average is about 8 days. This is high turnover. The entire inventory sells out and is replaced approximately 50 times per year.
On the opposite extreme is a car dealer or yacht dealer. Their inventory might take a year or more to “turn over”. So you can see that high turnover or high velocity results in more transactions and more economic activity.
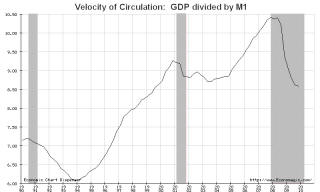
In a larger macro economic sense, on a nationwide basis if you divide the total Gross Domestic Product (GDP) by the Money Supply (M1) you get the Velocity of Money. As we can see from the following chart the velocity of money climbed steadily from turn over of just above six per year in 1994 through a high of just under 10.5 in 2008. As the economy heated up people spent their money faster.
During times of high inflation and prosperity people don’t hang on to their money very long, either from fear of it’s losing value or because they feel rich and think they can spend to their hearts content. During periods of recession ( the gray bars on the chart) the velocity of money falls as people start saving and conserving. There was one break in the steady ascent during the 2001 recession. It is interesting to note that even after the official recession ended in 2002 it took several years before the velocity of money began climbing again.
But now we see that people have slowed their purchases as we entered a longer recession and the money’s velocity has once again fallen to about 8.5. So the first force contradicting helicopter Ben’s thesis is the velocity of money.
If people are saving more, they are borrowing less and spending less. So all that happens is that people are paying down debt and building their reserves. This does not “stimulate the economy” or drive up prices, so it reduces the government’s ability to impact deflation.
The next factor working against the effectiveness of the government’s fight against deflation is the money multiplier. In a “Fractional Reserve” system like the one in the U.S., banks are required to keep a certain amount of reserves to cover withdrawals, but it is not 100%, they can loan out the rest. For instance, if the reserve requirement is 10% they can loan out the other 90%. So if Bank #1 gets $1000 in deposits it can loan out $900, which theoretically goes to bank #2 , which loans out 90% of $900 or $810 which goes to bank #3 and so on. This is the “Money Multiplier”.
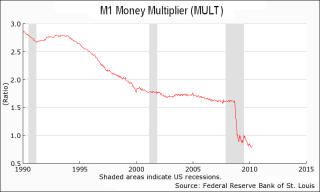
But what happens if one (or all) of the banks decides it isn’t prudent to loan out the money and they prefer to increase their reserves instead? In that case, the money multiplier falls. In the following chart we can see that the M1 money multiplier has actually fallen steadily from just under 3x in 1990 to 1.5x in 2008 (in contrast to the velocity of money which rose). But in 2008 the money multiplier plummeted to under 1x. What does that mean? Any kid can tell you, if you multiply by 1 you get the same number, no multiplication has happened.
But if you multiply by less than one, you end up with less than you started with! In other words, every dollar the government is pumping into the economy is ending up in the banks and going nowhere! It is not increasing the money supply, it is not multiplying, it is not creating inflation. It is going to boost the balance sheets of the banks.
In 2002, at about the same time as Bernanke was making his famous helicopter speech, Robert Prechter published a book entitled “Conquer the Crash” in which he made this exact argument. That when the tide turns there is nothing the government can do. The combined forces of the velocity of money and the money multiplier are stronger than the government’s printing presses.
For more info see:
- The Inflation or Deflation Debate
- Deflation and Depression Comparison
- 10 Tips for Dealing with Deflation
- Can the Government Really Stop Deflation?
- Jaguar Deflation
- 3 Deflation Myths


Good
Very interesting information
Hi, your article helped me to do a presentation, thanks for that, but I noticed an error. Your analyse of the last chart (MM) is wrong, the left scale is a ratio, not the real number of the money multiplier. So the MM does not fall under 1. You can find easily the same chart with the real number (M2/M1) with google .
According to the St. Louis FED the M1 Money Multiplier is “The M1 multiplier is the ratio of M1 to the St. Louis Adjusted Monetary Base.” http://research.stlouisfed.org/fred2/series/MULT