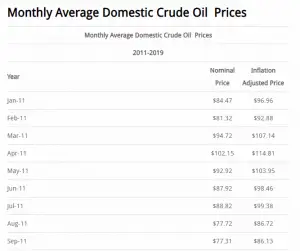
Oil Price Inflation This month we have updated the Crude Oil Inflation Chart which shows historical crude oil prices and also what they would be if you adjusted them for inflation as of February 2019. We have also updated the Annual Crude Oil Prices Table and the Monthly Crude Oil Prices Table both of which also show prices adjusted for inflation. The nominal price of a barrel of oil was only $1.37 back in 1946 but the inflation adjusted price of oil was $18.92 per barrel. (The nominal price is the price you would have actually paid at the time). The major peaks occurred in December 1979, October 1990, and June 2008 at $125.23, $65.68, and $145.93 respectively (all inflation adjusted to … [Read more...]
Energy Inflation- Oil and Gas Inflation
By Tim McMahon, editor It is extremely difficult to decide how over or under priced a commodity is when the scale we are comparing it to is constantly changing. By adjusting for inflation we can see what is happening to the price much easier. It pays to know what prices are in "Inflation Adjusted Terms". Once we adjust the gasoline price for inflation we can see that the average price for a gallon of gas since 1918 in June 2010 dollars is $2.39. So it is easy to tell whether gas is currently "cheap" or "expensive". For instance, the Annual Average gasoline price for 2009 was $2.34, which was extremely close to the long term average price of $2.39. While in 2008 the annual average … [Read more...]


