• Home
  • Related Sites
    • Financial Trend Forecaster
      • Moore Inflation Predictor
      • NYSE Rate of Change (ROC)
      • NASDAQ Rate of Change (ROC)
      • Crypto ROC- BTC & ETH
    • Unemployment Data
      • Historical Employment Data
      • Unemployment Rate Chart
      • Labor Force Participation Rate
    • Optio Money
    • Elliott Wave University
    • More Resources
  • Definitions
    • What is Inflation?
    • What is Core Inflation?
    • Inflation vs CPI
    • What is Deflation?
    • What is Disinflation?
    • What is Agflation?
    • What is Stagflation?
    • What is Hyperinflation?
    • What is Quantitative Easing?
    • What is Quantitative Tightening?
    • What is Velocity of Money?
    • What is Fiat Currency?
    • How Do I Calculate Inflation?
    • What are “Sticky Prices” and Why Do They Matter?
  • Featured Content
  • About Us
  • Feedback
    • Sitemap
  • Subscribe Now

InflationData.com

Your Place in Cyber Space for Inflation Data

CPI Index

CPI / Inflation-for August 25
  • Numerical Inflation Data
    • Current Inflation Rate
    • Monthly Inflation Rate
    • Historical U.S. Inflation Rates
    • Historical CPI
  • Inflation Charts
    • Ann. Inf. Rate Chart
    • Long Term Inflation >
      • Ave. Inf. by Decade
      • Total Inf. by Decade
      • Inflation 1913-1919
      • Inflation 1920-1929
      • Inflation 1930-1939
      • Inflation 1940-1949
      • Inflation 1950-1959
      • Inflation 1960-1969
      • Inflation 1970-1979
    • Cumulative Inflation
    • FED Monetary Policy and Inflation
    • Inflation and Recession
    • Confederate Inflation (1861 – 1865)
    • Misery Index
    • The 3 Stages of Inflation
    • 15-Yr Inflation Trends Chart
  • Inflation Calculators
    • Cumulative Inf. Calc.
    • How Much Would it Cost
    • Salary Inf. Calc.
    • Cost of Living Calc.
    • U.K. Inf. Calc.
    • Cost of Gas Calc.
    • Net Worth Calc.
    • Lifetime Earnings Calc.
    • Savings Goal Calc.
    • Financial Calculators
  • Inf. Adjusted Prices
    • Energy >
      • Inflation Adj. Gas Prices
      • Historical Oil Prices Chart
      • Crude Oil Price (Table)
      • Natural Gas Prices
      • Electricity Prices
      • Oil vs Gold
    • Gold >
      • Inflation Adjusted Annual Average Gold Prices
      • Gold is a “Crisis Hedge” not an  “Inflation Hedge”
      • Comparing Oil vs. Gold
    • Corn Prices
    • Education Inflation
    • Housing Prices
    • Mortgage Rates
    • NYSE Index
    • Inf. Indexed Bonds
    • Movie Revenues
    • Inflation-Adjusted Wages
  • Cost of Living
    • Calculate Cost of Living
    • Cost-of-living Adj. (COLA)
    • Consumer Price Index CPI
      • Historical CPI
      • Current CPI
      • CPI Release Dates
    • Gas Prices >
      • Cost of Gas
      • Cost of Gas Per Month
      • Gas vs. Oil Price Chart
    • Food Prices 1913 vs 2013
    • Health Insurance
  • Blog
    • Key Inflation Articles
    • International Inflation
    • Historical Inflation Rates for Japan (1971 to 2014)
You are here: Home » Historical Gas Price Chart

Historical Gas Price Chart

January 15, 2016 by Tim McMahon 9 Comments

The chart below shows the Nationwide average price of gasoline over the last year (12 months) compared to the gas price in Dallas and the price in Los Angeles. You can change the time period to see anywhere from 1 month to 6 years. Simply select the time period you wish to see from the list at the top. You can also choose different cities and time periods from the customization box below the chart.

%CODE8%

The following table compares the current average gas price statewide between New York, California and Texas. As of this writing, the result is as you would expect… Texas gas prices are lower than New York and much lower than California.

At first glance, you might think that it is purely a function of the proximity of oil wells. After all, Texas is known for its oil wells. However, after a bit of reflection you might think refinery location would actually be more important. After all, if oil has to be shipped long distances to a refinery and then the gas has to be shipped back, it isn’t going to help the local price of gas.

%CODE9%

Gas Prices North & South CarolinaYes, Texas has 28 refineries, but California has 17 refineries, and New York doesn’t have any. Although New Jersey has 6 (although 3 of them have been closed) and Pennsylvania has 6 more that are operating.  Therefore distance to refineries is not a significant factor for any of the three states we are looking at. For more information see Complete List of U.S. Oil Refineries.

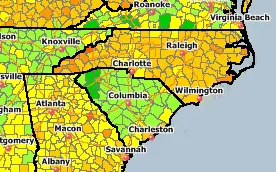
Plus, when we look at the list of Oil Refineries in the U.S. neither North or South Carolina have any refineries. And as we can see on the Gas Price Chart South Carolina has significantly lower gasoline prices than North Carolina and even adjacent counties across state lines have significant price differences.

So why would prices differ so drastically across state lines?

Obviously, the key factor in gas prices is not the distance to a refinery…

But some arbitrary line on a map. Hmmm, could it be related more to governments than to oil companies?

When we look closely we see that the amount of state sales and highway taxes included in the price of gasoline varies greatly and is the key factor to the price differential.  According to the American Petroleum Institute : (as of 1/15/16) (follow the link to API for the most current rates).

State State Taxes Federal Excise Tax Total Taxes per Gallon
Texas  20¢/gal. 18.40¢/gal. 38.40¢/gal.
New York  42.64¢/gal. 18.40¢/gal. 61.04¢/gal.
California  40.62¢/gal. 18.40¢/gal. 59.02¢/gal.

And if we we look at the differences in taxes between North and South Carolina we see:

State State Taxes Federal Excise Tax Total Taxes per Gallon
North Carolina  35.25¢/gal. 18.40¢/gal. 53.65¢/gal.
South Carolina  16.75¢/gal. 18.40¢/gal. 35.15¢/gal.

So it is obvious why people from North Carolina drive across the state line to get gas (to save 18.5¢/gal. in taxes).

You might also like:

  • Inflation Adjusted Gasoline Prices
  • Gasoline vs. Crude Oil Prices
  • Historical Gas Price Chart
  • Current Average Cost of Gas by County
  • Gasoline Taxes by State
  • Average Cost of Gas Per Month
  • Calculating Miles Per Gallon
  • Regarding Gas Inflation
  • Historical Oil Prices Chart
  • Gasoline Rewards Credit Cards
  • More Inflation Adjusted Prices

About Tim McMahon

Connect with Tim on Google+.

  • Web
  • |
  • Twitter
  • |
  • Facebook
  • |
  • LinkedIn
  • |
  • More Posts(399)

Comments

  1. Pete Montero says

    February 15, 2017 at 5:53 pm

    I’m finding your Canadian prices to be higher than, for example, when I query on GasBuddy.com, itself. For example, just for comparison’s sakes, if I run a query on that sight, in it’s fuelinsights section (http://fuelinsights.gasbuddy.com/Charts), comparing U.S. National and Canadian National Regular gasoline price, Canada (on Feb. 15, 2017) is at $3.053 (USD). You’re showing it at something near $4.04 (can’t see the data to get the exact amount).

    Can you tell me if there’s another variable that’s not obvious? It looks like you’re both claiming USD currency. Inflation (current vs. some historic value)?

    Thanks!

    Reply
    • Tim McMahon says

      March 15, 2017 at 9:56 am

      Pete,
      Not sure why their data would be different since our data comes from a direct feed from GasBuddy we actually have no control over it. The only part we control is the table.

      Reply
  2. lyle says

    January 6, 2016 at 1:34 pm

    your state+federal tax numbers in the chart is adding something twice – CA total with federal is not $.89/gal – it’s more like $.69 so I think you’re adding the .18 federal twice in your calcs.

    Reply
    • Tim McMahon says

      January 15, 2016 at 11:55 am

      Lyle,

      Thanks for pointing that out! Note that several states have actually decreased their gasoline taxes since the article was originally published back in 2013 (perhaps due to the decrease in oil prices). I’ve updated the hard-coded numbers in the tables as of January 15, 2016. If you follow the link http://www.api.org/oil-and-natural-gas-overview/industry-economics/fuel-taxes/gasoline-tax embedded in the article you will get the current rates. If you click on California on that map it pulls up a PDF document telling about the decrease in gasoline taxes and a corresponding increase in Diesel taxes.

      Reply
      • Dale says

        January 8, 2017 at 9:24 pm

        Taxes is one of the main reasons Oklahoma has the worse roads in the nation but the lowest fuel taxes. You get what you pay for.

        Reply
        • Tim McMahon says

          January 18, 2017 at 1:25 pm

          Except when Government and corruption are involved then you always get less than you paid for. 🙂

          Reply
          • Billy C. says

            May 13, 2019 at 5:58 pm

            So you would agree that zero taxes would make those Oklahoma roads the best in the country?

          • Tim McMahon says

            July 10, 2019 at 2:21 pm

            Not sure how you came to that conclusion?

        • Jim says

          January 4, 2025 at 3:01 pm

          for zero tax it would make me look at those shitty roads and in my eyes they’d be just great, might even go so far as to see them paved in pure gold… hmmm pure gold sure has a lot of potholes… lol.

          Reply

Leave a Reply Cancel reply

Your email address will not be published. Required fields are marked *

This site uses Akismet to reduce spam. Learn how your comment data is processed.

Latest Posts

  • August 2025 Inflation Report
  • Is the FED Getting Soft on Inflation?
  • July Inflation Report
  • AI Is Deflationary But Its Energy Demand Could Fuel Inflation
  • June Inflation Up Again
  • FED’s Semiannual Monetary Policy Report
  • What Is the Trimmed Mean CPI and What Is It Good For?
  • May 2025 Inflation Up Slightly

Sponsored:

Get 3 Stocks Poised to Join the "Trillion Dollar" Club - FREE

Futurist Eric Fry has recommended 40+ stocks that have gone on to soar more than 1,000%. Now, he's revealing 3 new AI stock picks he predicts could soon reach the coveted trillion-dollar milestone. Only 10 companies in history have surpassed the $1T mark, but AI is accelerating wealth creation faster than ever before. Get Eric Fry's research today and position yourself for what could be a very exciting ride to the top...

YES! Send me the names, tickers and research - FREE

----------

As a Seasoned Investor I thought I'd seen everything... But recently I discovered TradingView which has really improved the information I have at my fingertips.~ Tim McMahon, editor

Whether you're a beginner or a seasoned trader, TradingView gives you the edge. Access powerful charting tools, real-time market data, and a global community of traders—all in one intuitive platform. With hundreds of indicators, custom scripts, and seamless brokerage integration, TradingView isn't just a charting tool—it's your full trading command center.

Trade smarter. Trade faster. Trade with TradingView.

----------

The Best Place to Buy Your Crypto

Coinbase is the largest Crypto Trading platform in the U.S. and the easiest to use. ~Tim McMahon, editor

Check out Coinbase here

Subscribe Now

eTrends Signup Form

Elliott Wave Resources

Free Elliott Wave Resources

What is Waveopedia?

Waveopedia is EWI’s free, comprehensive index of Elliott wave patterns and terms. Everyone from beginners to experts can benefit from it. It’s a great place to send your followers if they’re new to Elliott waves.

  • Deflation Hits China is the U.S. Next?

  • Why You Must Avoid the Herding Trap

  • Chasing Trends Can Cost You

  • More Education Resources

Post Archives

Home | Articles | Sitemap | Terms of Service | Privacy | Disclaimer | Advertise With Us

Copyright © 1996-2025 · Capital Professional Services, LLC · Maintained by Design Synergy Studio · Admin

Do Not Sell My Personal Information