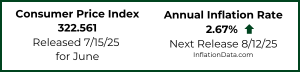
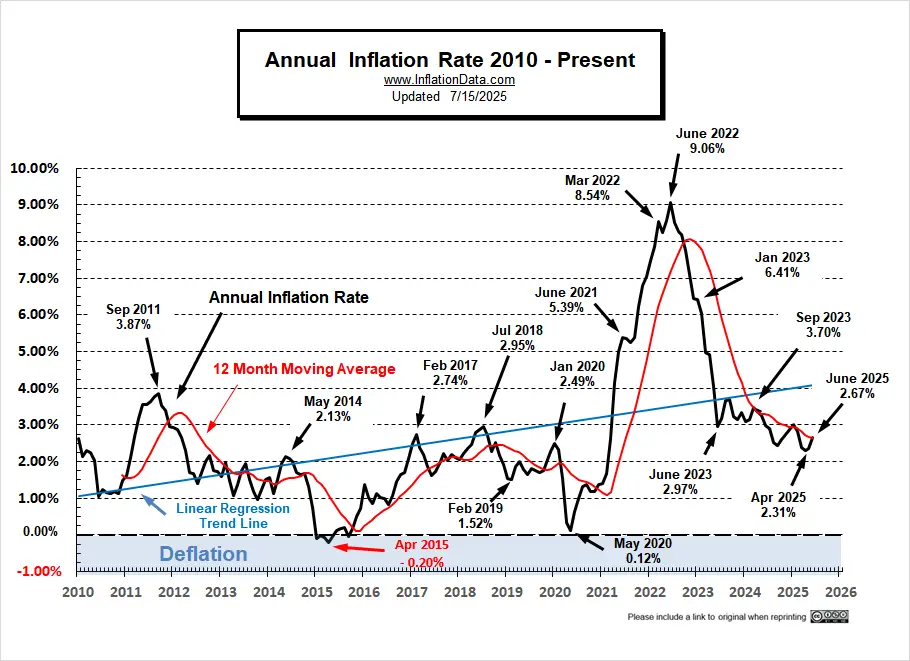
The U.S. Bureau of Labor Statistics released its June 2025 Inflation report on July 15th, 2025. The report showed that Annual Inflation was up from 2.4% in May to 2.7% in June.
Calculated to two digits, it was really 2.35% in May and 2.67% in June.
Economists were predicting higher inflation, of 2.6% while our MIP was projecting an “Extreme High” of 2.63%. The NYSE responded by falling about 1% on the day, on fears that this might postpone the FED’s rate cuts even further.
June’s Inflation Prediction:
At 2.67%, June’s inflation numbers came in slightly above last month’s “extreme high” projection.
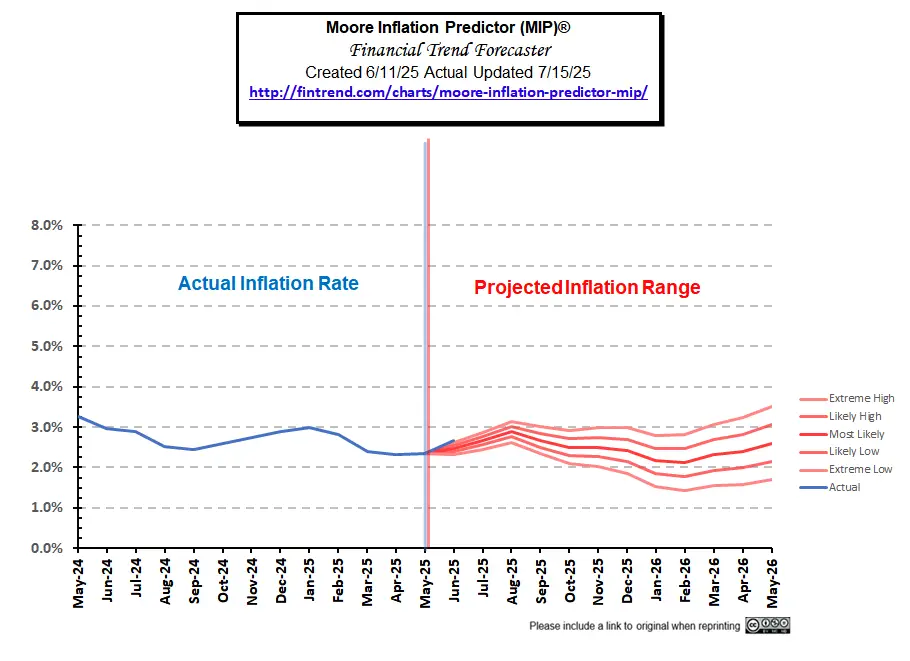
This Month’s MIP
The following chart is our projection for this month, indicating that once again there is the possibility of an uptick in inflation. Because monthly inflation from May through September of 2024 was much lower than normal, if we have a normal summer in 2025, those numbers will be higher this year than last year, causing annual inflation to begin rising. This could cause the FED to postpone lowering interest rates once again. June should be flat to slightly up, with a peak around August (possibly just over 3%). And then a decline from there.
 The summer 2024 monthly numbers were:
| May-24 | Jun-24 | Jul-24 | Aug-24 |
| 0.17% | 0.03% | 0.12% | 0.16% |
June’s monthly inflation was 0.34%, so if we have another two months like that, annual inflation will still rise.
See this month’s MIP prediction
Annual Inflation… 2.67% in June 2025
- Annual Inflation rose from 2.35% to 2.67%
- CPI Index rose from 321.465 to 322.561
- Monthly Inflation for June was 0.34% slightly above April’s 0.31%
- Next release August 12th, 2025
| Jan | Feb | Mar | Apr | May | June | July | Aug | Sep | Oct | Nov | Dec | |
| 2025 | 3.00% | 2.82% | 2.39% | 2.31% | 2.35% | 2.67% | NA | NA | NA | NA | NA | NA |
| 2024 | 3.09% | 3.15% | 3.48% | 3.36% | 3.27% | 2.97% | 2.89% | 2.53% | 2.44% | 2.60% | 2.75% | 2.89% |
| 2023 | 6.41% | 6.04% | 4.98% | 4.93% | 4.05% | 2.97% | 3.18% | 3.67% | 3.70% | 3.24% | 3.14% | 3.35% |
BLS Commentary:
The BLS Commissioner reported:
“The Consumer Price Index for All Urban Consumers (CPI-U) increased 0.3 percent on a seasonally adjusted basis in June, after rising 0.1 percent in May, the U.S. Bureau of Labor Statistics reported today. Over the last 12 months, the all items index increased 2.7 percent before seasonal adjustment…
The all items index rose 2.7 percent for the 12 months ending June, after rising 2.4 percent over the 12 months ending May. The all items less food and energy index rose 2.9 percent over the last 12 months. The energy index decreased 0.8 percent for the 12 months ending June. The food index increased 3.0 percent over the last year.”
Looking at table A below, we can see that on an annual basis, energy commodities (like Gasoline) are still down, but energy services (like electricity) are up.
Also up on an annual basis, were Services including Food away from home, shelter, transportation, and medical services.
Inflation: All Items vs. Without Food and Energy
Although these “Seasonally Adjusted” numbers are slightly different than those typically presented by the BLS, the following chart from the Federal Reserve shows the gap between inflation with and without Food and Energy. Comparing the two highlights how much food and energy contribute to overall inflation.
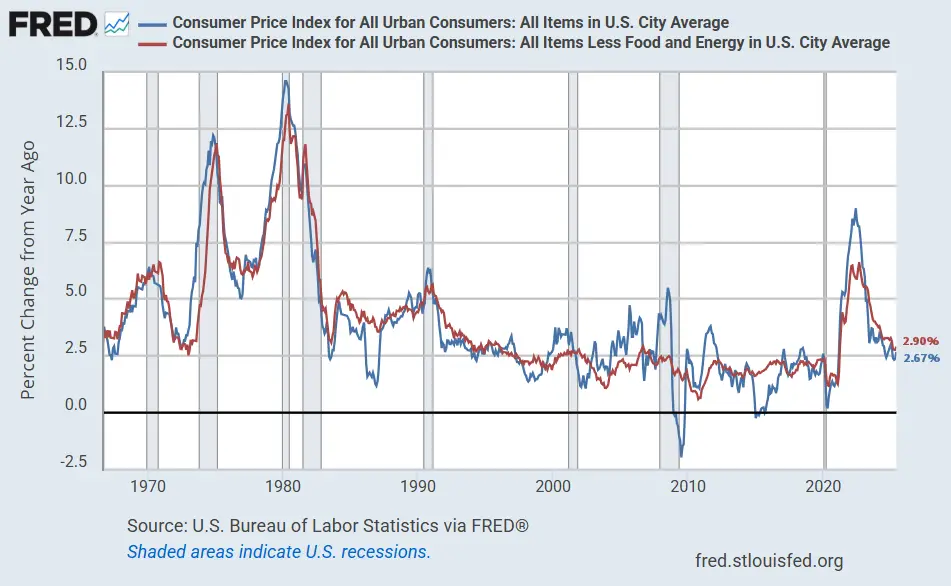 Without food and energy, inflation would be 2.90%. But, due to the downward pressure of Energy, total inflation according to the FED is 2.67%.
Source: St. Louis FED
FED Monetary Policy
June 2025 Summary:
- FED Assets are Falling
- M2 Money supply is rising
- FED Funds Rates Remain at 4.33%
FED Assets and M2 Money Supply
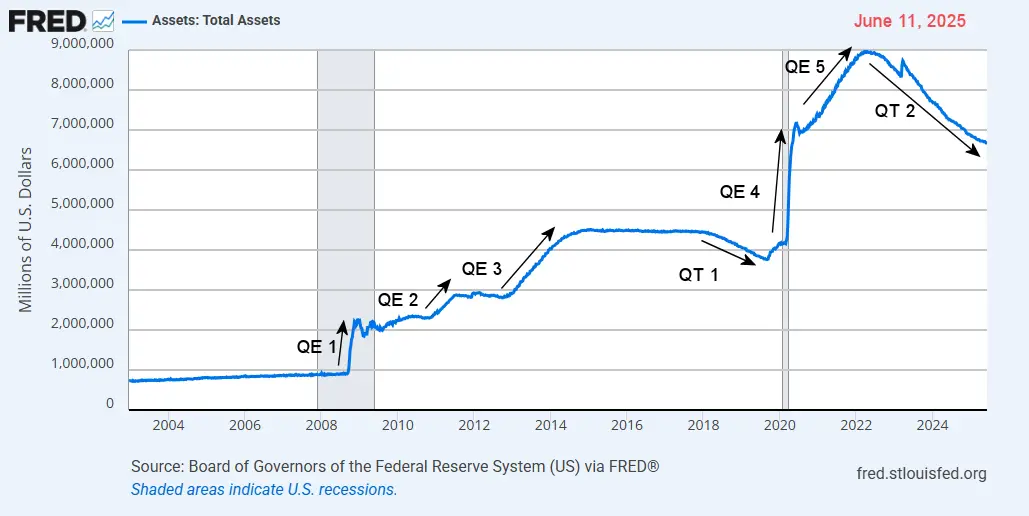 FED Assets continue downward.
 BUT… rather than decline as FED assets are doing, M2 returned to the same upward slope of increase as from 2012-2020 (#5).
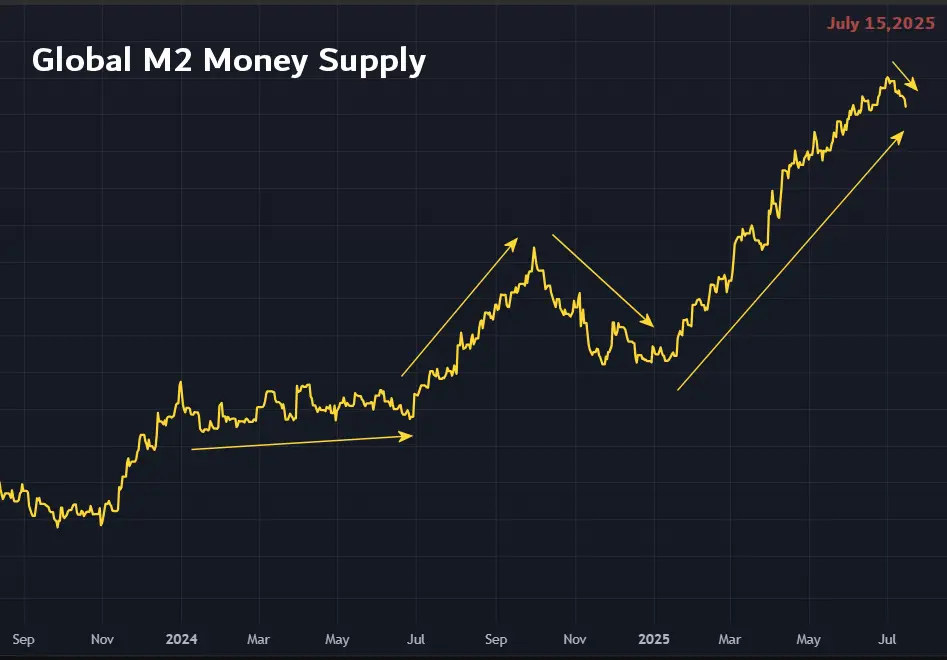
Global M2
The FED isn’t the only one pumping the money supply. Most other countries also follow the FED’s lead. So, Global M2 Money Supply (the composite of all the major countries’ money supplies) is also growing. We can see that on a global scale, the money supply has been increasing throughout 2025, up until the last 10 days, which is showing a decrease. Generally, an increase in the money supply will result in a rising stock market with a 2 to 4-month delay. Starting at just over 100 in January 2024, the Global M2 is now above 112, or a 12% increase in about 18 months.
The first half of 2024 showed only a moderate increase, followed by a sharp increase in the 3rd quarter of 2024. Much of that increase was retraced in the 4th quarter of 2024 (resulting in a pullback in the Stock Market in Q1 2025). Since then, we have seen a huge increase in Global M,2 which has started to reignite the stock market.
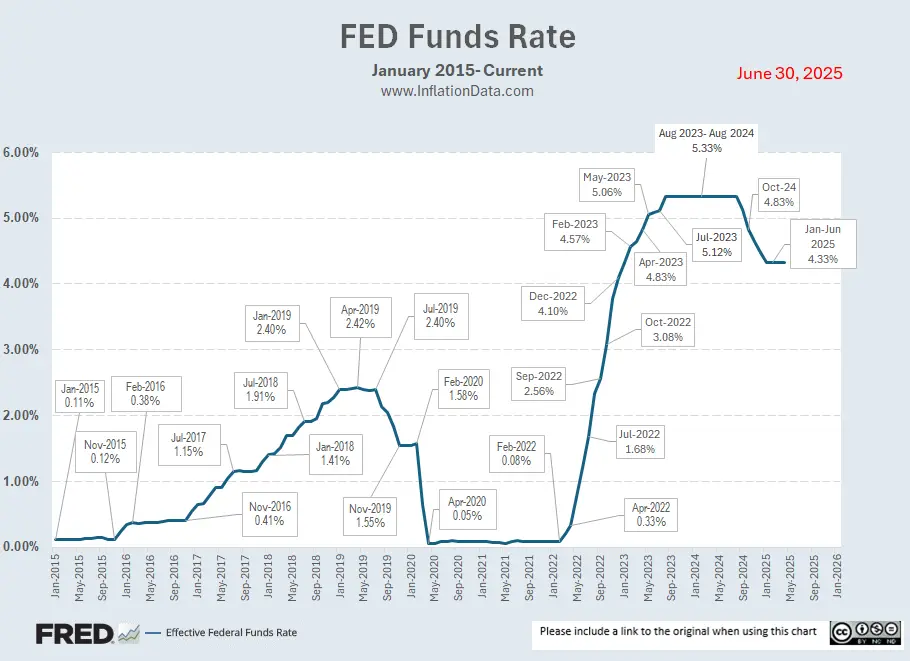
FED Funds Rate
The chart below shows the rapid increase in interest rates from February 2022, when they were just 0.08%, to a year later, when they were at 4.57%. From August 2023 through August 2024, the FED maintained a stable Funds Rate at 5.33%. Then, in September, the FED announced a 1/2% reduction in the range. October numbers show the rate at 4.83%. At its November meeting, the Fed lowered the federal funds target range by 25 basis points to 4.5%-4.75%, with the actual rate coming in at 4.48% in December. On December 19, 2024 they lowered the target range to 4.25 – 4.50%. Since then, the FED held its Funds rate steady from January through July 2025 at 4.33%. And it continued to hold steady at the May 7th FED Meeting.
More info about FED Monetary Policy and Inflation
Inflation Chart
Monthly Inflation Compared to Previous Years:
The monthly inflation rate for June was 0.34% and May 2025 was 0.21%. But, annual inflation still rose because June 2024 was only 0.03%.

Not Seasonally Adjusted Monthly Inflation Rates
Note: January 2022’s 0.84% was the highest January since 1990. June was the highest June since 1941 (although the first quarter of 1980 had some higher rates). Typically, the first quarter has the highest monthly inflation and the 4th quarter is the lowest (even negative).
| Jan | Feb | Mar | Apr | May | Jun | Jul | Aug | Sep | Oct | Nov | Dec | |
| 2016 | 0.17% | 0.08% | 0.43% | 0.47% | 0.41% | 0.33% | (0.16%) | 0.09% | 0.24% | 0.12% | (0.16%) | 0.03% |
| 2017 | 0.58% | 0.31% | 0.08% | 0.30% | 0.09% | 0.09% | (0.07%) | 0.30% | 0.53% | (0.06%) | 0.002% | (0.06%) |
| 2018 | 0.54% | 0.45% | 0.23% | 0.40% | 0.42% | 0.16% | 0.01% | 0.06% | 0.12% | 0.18% | (0.33%) | (0.32%) |
| 2019 | 0.19% | 0.42% | 0.56% | 0.53% | 0.21% | 0.02% | 0.17% | (0.01%) | 0.08% | 0.23% | (0.05%) | (0.09%) |
| 2020 | 0.39% | 0.27% | (0.22%) | (0.67%) | 0.002% | 0.55% | 0.51% | 0.32% | 0.14% | 0.04% | (0.06%) | 0.09% |
| 2021 | 0.43% | 0.55% | 0.71% | 0.82% | 0.80% | 0.93% | 0.48% | 0.21% | 0.27% | 0.83% | 0.49% | 0.31% |
| 2022 | 0.84% | 0.91% | 1.34% | 0.56% | 1.10% | 1.37% | (0.01%) | (0.04%) | 0.22% | 0.41% | (0.10%) | (0.34%) |
| 2023 | 0.80% | 0.56% | 0.33% | 0.51% | 0.25% | 0.32% | 0.19% | 0.44% | 0.25% | (0.04%) | (0.20%) | (0.10%) |
| 2024 | 0.54% | 0.62% | 0.65% | 0.39% | 0.17% | 0.03% | 0.12% | 0.08% | 0.16% | 0.12% | (0.05%) | 0.04% |
| 2025 | 0.65% | 0.44% | 0.22% | 0.31% | 0.21% | 0.34% |
See: Monthly Inflation Rate for more information and a complete table of Unadjusted Monthly Rates.
Misery Index
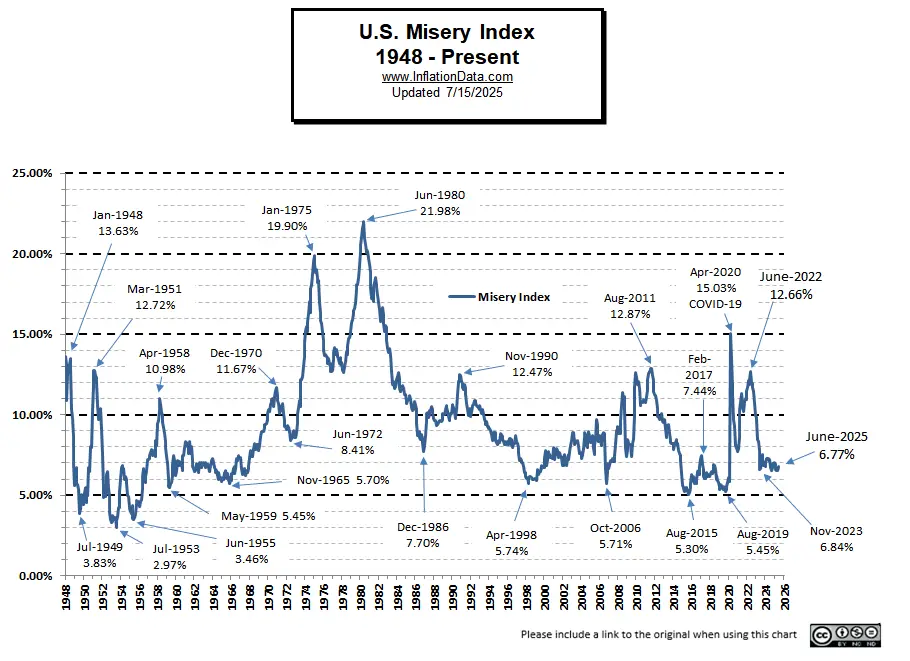
Current Misery Index:
Unemployment 4.10% + Inflation 2.67% = 6.77%
This month, inflation is up and unemployment is down slightly, so the misery index is up slightly to 6.77% from 6.55%.
 [Read More on the Misery Index…]
Rate of Change (ROC)
As of June 2nd, the NYSE ROC still has a Sell Signal. See NYSE Roc for more information.
The NASDAQ ROC also remains in sell mode. See NASDAQ Roc for more information.
Bitcoin however, generated a buy signal!

Ethereum has been zooming, after generating a BUY signal.
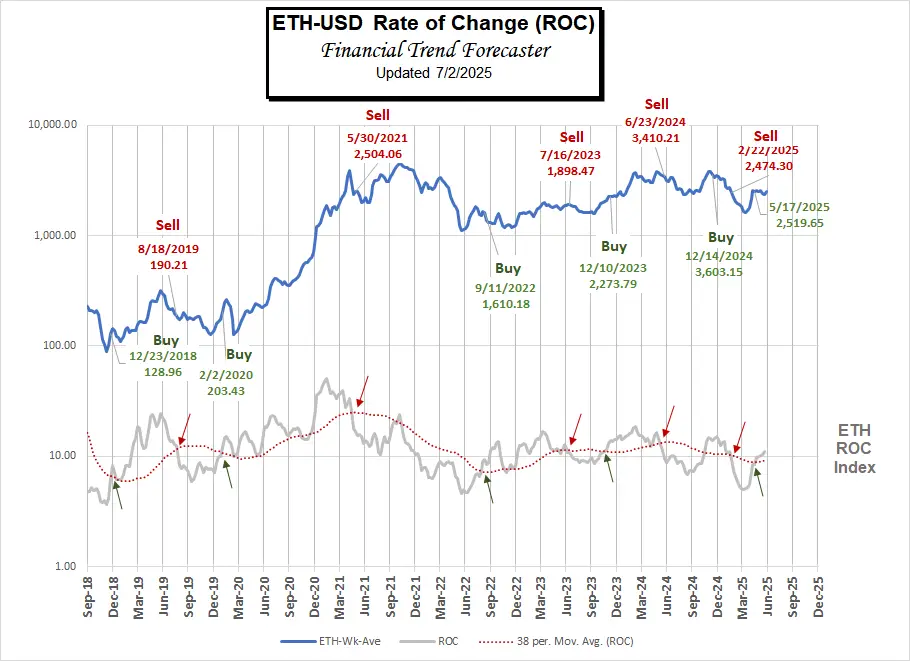
For more information, see NYSE Rate of Change (ROC) , NASDAQ ROC Chart, and Crypto ROC .
You Might Also Like:
From InflationData.com
- FED’s Semiannual Monetary Policy Report
- What Is the Trimmed Mean CPI and What Is It Good For?
- May 2025 Inflation Up Slightly
- The Truth About Why Gold Is Surging
From Financial Trend Forecaster
- NYSE ROC
- NASDAQ ROC
- Crypto ROC
- Big New Tax Deductions for Seniors and Others in 2025
- Trump Pushes Crypto for Mortgages
- Will AI And Bitcoin Mining Balance Or Destroy the Grid?
- Amazon and Walmart Consider Issuing Their Own Stablecoins
- Breaking Free from China’s Rare Earth Monopoly
- The U.S. Housing Market in 2025: More Sellers Than Buyers
- ETH Buy Signal
- The Potentially Devastating Differences Between CBDCs and Stablecoins
From UnemploymentData.com.
- June Seasonally Adjusted Unemployment Down
- Blue-Collar Wages Surge in 2025
- Does Raising The Minimum Wage Make A Substantial Difference?
From Elliott Wave University
- This Forecasting Tool Nailed the S&P Turns
- Warren Buffett isn’t buying — and that says a lot.
- Debt Ceiling Drama
- Stock Market Signal: Only 3 Times in 47 Years!
- Tesla’s Troubles — Is it Musk or is it More?
From OptioMoney
- What is a “Haircut” in Financial Terminology
- How To Protect Your Wallet When You’re Just Starting Out
- Consumer Culture Contrasting Spending Habits in the US and Europe
- Financial Considerations When Moving to Florida
From Your Family Finances
- What is a “Haircut” in Financial Terminology
- How To Protect Your Wallet When You’re Just Starting Out
- Consumer Culture Contrasting Spending Habits in the US and Europe
- Financial Considerations When Moving to Florida

Leave a Reply