On Wednesday March 15th the U.S. Bureau of Labor Statistics (BLS) released their monthly Inflation report for the 12 months ending February 28th . The Consumer Price Index (CPI-U) came in at 243.603 up from 242.839 in January. This resulted in a 0.31% monthly inflation and 2.74% annual inflation. The last time the annual inflation rate was this high was in February of 2012 when it was 2.87%.
After a deflationary period from March through October 2009, massive quantitative easing, caused a 2 month flirtation with inflation nearing 3% but then inflation promptly fell and by June 2010 inflation was 1.05% again. The inflation rate spent the next several months bouncing around between 1% and 2%.
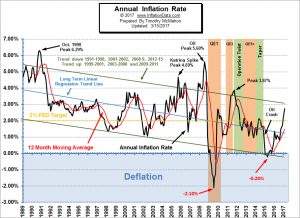 In 2011 it looked like inflation had returned and on September 2011 annual inflation reached 3.87%. From there it drifted down to 2.65% in March 2012 and we have not seen that level since. As a matter of fact for several months in early 2015 inflation was actually negative (i.e. deflation).
For more information see: Annual Inflation Rate Chart
Misery Index 2017:
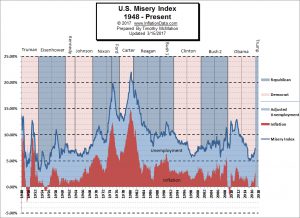 The misery index as of March 2017 (based on the most recent official government data for the 12 months ending in February) is at 7.44% (4.7% unemployment and 2.74% inflation) up from last month’s 7.30% but well below the peak of 12.87% in both October and November 2011 which was pretty miserable. With inflation rebounding to more normal levels, the Misery index is inching upward.
See: Misery Index
Moore Inflation Predictor (MIP)
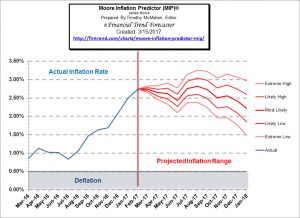
February’s annual inflation rate was up sharply at 2.74% from January’s rate of 2.50%. Which was more than double August’s 1.04%. Our MIP was projecting an up move this month but didn’t project we would reach 2.74%. So inflation picked up faster than expected. Monthly inflation for January was a massive 0.58% and February was 0.31%.
See what the Moore Inflation Predictor is forecasting now.
Current NYSE-ROC Analysis:
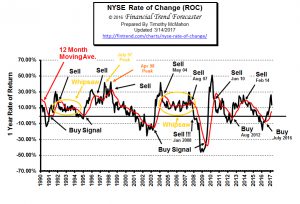 BUY Signal Continues!
A buy signal was generated in July 2016 and the ROC continues the Buy signal but the rate of acceleration has peaked.
This month the monthly rate of return was 0.53% down from 1.81% last month. The annual rate of return shot up to over 26% last month but fell to 13.64% this month. This gives us a peak after shooting up from below zero so we would expect it to drop through the moving average shortly. If it enters a whipsaw pattern bouncing around 10% like it has in the past (1992-1995) and (2004-2008) the market will be very happy indeed. If it follows the pattern of “recovery” like 2014-2016 not so much.
See: NYSE Rate of Change for more info.
Current NASDAQ-ROC Analysis:
Buy Signal Continues! But the Acceleration to the upside has peaked.
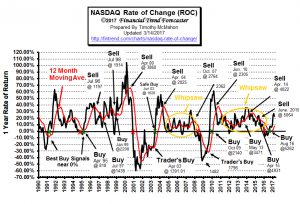 The NASDAQ index increased 1.76% since last month on top of 3.6% last month and 2.18% the previous month. So the rate of increase is down. Annual returns are 23% but this is down from February’s whopping 27% above year prior levels. It remains well above its moving average thus maintaining a buy signal, but it has turned down.
See: NASDAQ Rate of Change for more info.
You might also like:
- Is a Second OPEC Cut In The Cards?
- Are Oil Production Costs Rising or Falling?
- Cryptocurrency: Is Bitcoin the Future of Money?
- Gold Prices Inching Higher
- How Much Has Inflation Affected Mortgage Rates in the Last 5 Years?
- Preparing for a Healthcare Job Interview
- New Unemployment Numbers- February
- Trump Bump Slaughters Market Bears
- Will Stocks Finally Break out of the 35 Year Box?
- US Drives Global Growth
- Rare Signal Says Stock Rally Is The Real Deal
- Is Silver Worth Buying in 2017?
- Ideas to Improve Your Money Management Skills
- Putting Precious Metals in Your IRA
- 5 Ways to Take Real Estate Investment to the Next Level
- What You Need to Know About Non-Bank Lending
- Cut Your Food Budget and Save Big
- Personal Investing and Stock Advice for Growing Families
- Cross Country: Tips For Your Next Move
- Hedge Your Nest Egg Against the Uncertainty of Inflation


Leave a Reply